


Table of Contents Show
In our fast-paced world, visual tools like bubble diagrams have become indispensable for breaking down complex ideas into digestible, easy-to-understand pieces. Whether you’re brainstorming for a new project, organizing information, or planning out a story, bubble diagrams can be your best ally. They help us visualize relationships, hierarchies, and structures at a glance, making them a favorite among professionals and creatives alike.
But how do we create effective bubble diagrams that truly serve our purpose? It’s not just about drawing circles on a piece of paper. There’s an art and science to it, blending creativity with methodical planning. In the following paragraphs, we’ll dive into the essentials of crafting bubble diagrams that not only look good but also enhance your ability to communicate complex ideas with simplicity and precision. Let’s embark on this visual journey together, mastering the skill of bubble diagram creation to unlock new levels of clarity and innovation in our work.

Understanding Bubble Diagrams
Following our exploration of the value of visual tools in presenting complex ideas, we now focus on bubble diagrams and their pivotal role in achieving clarity and innovation. Bubble diagrams stand out for their simplicity and effectiveness in structuring information. Here, we’ll dissect the essence and benefits of bubble diagrams, ensuring you can utilize them to their full potential.
The Concept and Functionality
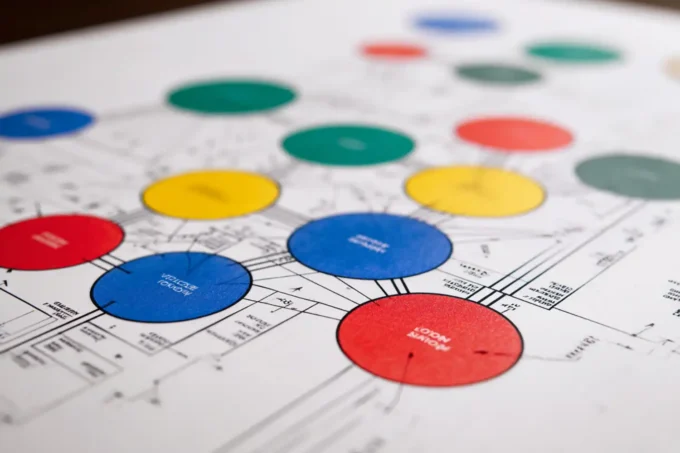
Bubble diagrams serve as a visually intuitive method for organizing and representing information. Fundamentally, these diagrams use circles or “bubbles” of varying sizes to depict different concepts or entities, with the spatial relationships between these bubbles illustrating the connections and hierarchies among the data points. This simplicity in design belies their versatility; bubble diagrams are invaluable in the early stages of project planning, whether for architectural designs, website layouts, or system architectures.
The functionality of bubble diagrams lies in their ability to provide a high-level overview of complex systems. By abstracting details into shapes, they help identify the relationships and relative importance of components within a system. Architects leverage bubble diagrams to plan room layouts based on function and flow, while web designers use them to map out site navigation. In essence, bubble diagrams act as a bridge between initial concept and detailed design, enabling planners and creators to explore possibilities without getting bogged down in specifics.
Advantages of Using Bubble Diagrams
Adopting bubble diagrams in project planning and conceptualization brings numerous benefits. First and foremost, they promote a better understanding of the project scope by displaying all critical elements and their interactions at a glance. This clarity encourages effective communication among team members and stakeholders, ensuring everyone has a shared understanding of the project’s structure and goals.
Additionally, bubble diagrams enhance flexibility in the planning process. Due to their abstract nature, changes can be made quickly and efficiently, allowing for rapid iterations of a project’s conceptual layout. This adaptability makes bubble diagrams an excellent tool for brainstorming sessions, where ideas evolve, and plans are refined in real-time.
Moreover, bubble diagrams serve as a springboard for creativity. By stripping away the complexities of detailed planning, they provide a sandbox for exploring different organizational approaches and spatial relationships. This freedom to experiment can lead to innovative solutions that might not emerge from more rigid planning methods.
Bubble diagrams are a cornerstone of effective project planning and conceptualization, marrying simplicity with functionality. Their capacity to clarify, communicate, and catalyze creativity makes them indispensable in various fields, from architecture to web design. Armed with an understanding of their concept and advantages, we’re better equipped to harness their potential, paving the way for projects that are both innovative and intuitive.

Essential Components of a Bubble Diagram
Creating a bubble diagram involves understanding its essential components, which serve as the building blocks for effective visualization and planning. In this section, we’ll delve into the core elements and how they form relationships through bubbles.
Identifying Core Elements
Every bubble diagram starts with identifying its core elements. These elements represent the individual concepts, ideas, or parts of the project that need organizing. In architecture, for example, core elements might include living space, dining area, and kitchen. In web design, they could be homepage, contact page, and product page. The first step in creating a bubble diagram is to list these core elements, ensuring that each one reflects a distinct part of the project or idea being mapped out.
- List individual concepts or parts: Clearly define what each bubble will represent.
- Determine the scale of elements: Decide on the relative sizes of bubbles based on their importance or hierarchy.
- Assign unique identifiers: Use labels or colors to differentiate between the elements, enhancing the diagram’s clarity.
By focusing on the core elements, we lay a solid foundation for the bubble diagram, establishing a clear scope for what will be visualized.
Establishing Relationships Through Bubbles
Once the core elements are defined, the next step is establishing relationships between them using bubbles. These relationships visually illustrate how the elements interact, depend on each other, or follow a hierarchy. The positioning and proximity of bubbles to one another denote these relationships, with closer bubbles usually indicating a stronger relationship or direct linkage.
- Position bubbles based on relationships: Arrange the bubbles to reflect the nature and strength of their relationships.
- Use lines or overlapping: Connect bubbles with lines to show direct relationships or overlap them slightly to indicate a shared boundary or function.
- Adjust bubble size and proximity: Modulate the size and how close the bubbles are to visualize the importance of relationships or the degree of connection.
This process of establishing relationships through bubbles not only aids in visualizing the structure and connections within the project but also encourages a deeper understanding of how each element interacts within the whole. The dynamic nature of bubble diagrams allows for easy adjustments, offering flexibility as the project or ideas evolve.
By focusing on these essential components, we ensure that our bubble diagrams effectively communicate complex systems, making them invaluable tools for planning and organization across various fields.

Steps to Create a Bubble Diagram
Creating a bubble diagram is a strategic process that enhances project planning and organization. By following these steps, you can effectively use bubble diagrams to bring clarity and creativity to your projects.
Defining Your Primary Goal
Establishing a clear objective is the first crucial step in creating a bubble diagram. It’s essential to pinpoint what you aim to achieve with your diagram. Whether it’s planning the layout of a home, organizing a website, or mapping out a complex process, having a well-defined goal guides the rest of the creation process. This clarity ensures that every element added to the diagram serves the purpose of achieving the project’s objective.
Brainstorming Session: Generating Ideas
Once the goal is set, we gather all relevant ideas through a brainstorming session. This step is about quantity over quality, encouraging the flow of as many ideas as possible. We jot down concepts, requirements, and elements that need inclusion in the bubble diagram. In architectural planning, for example, ideas might include living areas, kitchens, bathrooms, and outdoor spaces. For web design, brainstormed ideas could cover home pages, contact forms, product pages, and blogs. This stage ensures no critical component is overlooked.

Organizing and Grouping Ideas
After generating a list of ideas, our next step involves organizing and grouping similar concepts together. This organization forms the structure of our bubble diagram, with each group representing a bubble. In an architectural context, living spaces might cluster together, while utilities like laundry and bathrooms form another group. In web design, categorization might involve grouping all content-related pages under one bubble and user interactive features under another. This method helps in visualizing the project’s components and their hierarchies more clearly.
Connecting and Structuring Bubbles
The final step is about connecting and structuring the bubbles according to their relationships and the hierarchy established in the previous step. We draw lines or arrows between bubbles to show the connection and flow of information or movement between them. The positioning of bubbles closer or farther from each other can signify the strength or frequency of interaction between the represented elements. For example, in a home layout bubble diagram, the kitchen might be placed near the dining area to signify a strong relationship. In a website bubble diagram, the home page bubble might connect to all other bubbles, indicating it as the central hub.
By carefully defining the goal, brainstorming ideas, organizing these ideas into groups, and finally connecting and structuring these groups into a coherent diagram, we craft a bubble diagram that serves as a powerful tool for visualizing and planning our projects. This process ensures that our diagrams are both functional and informative, providing a clear path toward realizing our primary goal.
Tools and Techniques for Drawing Bubble Diagrams
Transitioning from the foundational steps of creating bubble diagrams, it’s essential to explore the tools and techniques that bring these visual representations to life. Choosing the right method and tool has a significant impact on the effectiveness and efficiency of the resulting diagram. Below, we delve into two major categories: manual sketching and digital tools, including the use of online platforms.
Manual Sketching vs Digital Tools
In the realm of bubble diagrams, creators often face the decision between manual sketching and digital tools. Both methods have unique benefits that cater to different needs and preferences.
Manual sketching, a traditional approach, allows for immediate, hands-on creation. It requires basic materials such as paper, markers, or pencils. This method is ideal for brainstorming sessions, offering flexibility to quickly add, remove, or adjust elements without constraints. Manual sketching fosters creativity and freeform thinking, making it a perfect starting point for conceptualizing ideas.
On the flip side, digital tools present a modern solution that brings precision and versatility. Software options range from specialized design applications like Adobe Illustrator to diagram-specific tools such as Lucidchart or Microsoft Visio. Digital platforms facilitate easy editing, sharing, and collaboration, which is invaluable in professional settings. They also offer extensive libraries of shapes and icons to enhance the visual appeal and clarity of bubble diagrams. Choosing a digital tool depends on specific project needs, collaboration requirements, and personal proficiency with the software.

Utilizing Online Platforms for Bubble Diagrams
Online platforms have emerged as a go-to choice for creating bubble diagrams, thanks to their convenience and collaborative features. These platforms are accessible from anywhere, requiring only an internet connection. They simplify the diagram creation process with user-friendly interfaces and drag-and-drop functionalities.
Platforms like Canva and Google Drawings provide templates and design elements that streamline the diagramming process. Users can quickly construct bubble diagrams, customize their appearance, and share them with team members or clients for feedback. The real-time collaboration feature found in many online platforms enhances teamwork, allowing multiple users to edit and comment on the diagram simultaneously.
Furthermore, online platforms often offer cloud storage, ensuring that work is automatically saved and can be accessed from any device. This not only protects against data loss but also supports a flexible work environment.
The choice between manual sketching and digital tools, including online platforms, hinges on the specific requirements of the project and the preferences of the individuals involved. While manual sketching excels in fostering initial creativity, digital tools and online platforms offer precision, efficiency, and collaboration capabilities that are invaluable in today’s fast-paced, interconnected world.
Advanced Tips for Effective Bubble Diagrams
Clarity and Simplicity in Design
Achieving clarity and simplicity in bubble diagram design is crucial for conveying complex data effortlessly. We emphasize starting with a clear objective for each diagram, ensuring every element serves a specific purpose. Limiting the number of bubbles and connections improves focus, making the diagram easier to understand. Use straightforward labels and maintain uniform bubble sizes where possible, reserving larger sizes to signify greater importance or complexity. This approach not only enhances aesthetic appeal but also aids in quick comprehension of the underlying concepts.
Color Coding to Differentiate Elements
Incorporating color coding effectively distinguishes between different elements or categories within bubble diagrams. We recommend selecting a palette that varies sufficiently to avoid confusion but remains harmonious to keep the diagram coherent. Utilizing colors strategically can guide the viewer’s eye, highlighting critical pathways or relationships without overwhelming with information. For instance, warmer colors can indicate urgency or priority, while cooler tones might denote background or less critical items. This method not only adds a visual layer of information but also makes the diagrams more accessible and engaging.
Balancing Information and Readability
Balancing the amount of information and maintaining readability is key to creating effective bubble diagrams. We advocate for the minimalist inclusion of text, focusing on keywords and essential data points rather than exhaustive descriptions within the bubbles. Ensuring adequate spacing between elements prevents overcrowding, preserving the diagram’s legibility even when densely packed with information. When necessary, incorporating legends or side notes offers a way to present detailed explanations without cluttering the main diagram. This balance keeps the viewer engaged, allowing for easier navigation through the diagram’s insights.
Practical Applications
In this section, let’s dive into the practical applications of bubble diagrams, focusing on how they revolutionize planning and architecture as well as streamline brainstorming and problem-solving processes.
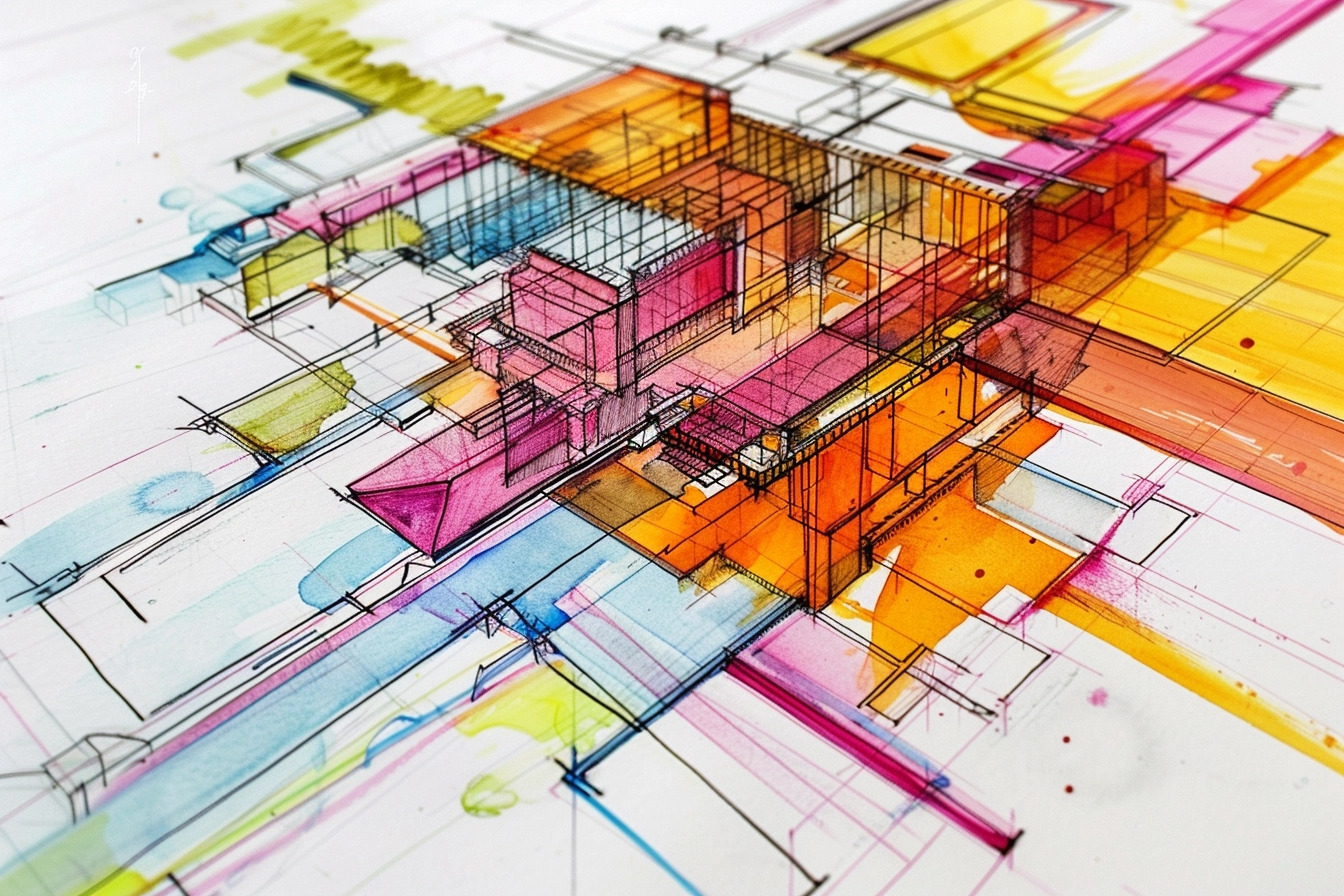
Bubble Diagrams in Planning and Architecture
Bubble diagrams play an essential role in planning and architecture, transforming initial concepts into actionable plans. By representing spaces as bubbles and illustrating their relationships and sizes relative to each other, architects and planners can effectively organize areas within a project. These diagrams help in visualizing the flow between different spaces, enabling a more intuitive understanding of how users will interact with the environment.
For instance, in residential design, bubble diagrams allow architects to position living areas, bedrooms, and kitchens in a way that maximizes efficiency and aesthetic appeal. They ensure that common areas are accessible while maintaining privacy in personal spaces.
Similarly, in urban planning, bubble diagrams facilitate the conceptualization of large-scale projects, identifying key zones such as residential, commercial, and green spaces. They optimize pedestrian flow and ensure that essential services are conveniently located, thereby enhancing the overall functionality of the developed area.
Using Bubble Diagrams for Brainstorming and Problem-Solving
Bubble diagrams serve as powerful tools for brainstorming and problem-solving, fostering creative thinking and collaboration. By breaking down complex problems into smaller, manageable elements, teams can uncover innovative solutions and identify key areas of focus.
During the brainstorming process, participants can use bubble diagrams to visually map out ideas and their connections. This visual representation encourages the exploration of different perspectives and the discovery of unexpected relationships between concepts. For example, in product development, teams might use bubble diagrams to explore potential features, target markets, and user needs, identifying opportunities for innovation.
In problem-solving scenarios, bubble diagrams assist in deconstructing the issue into its core components, making it easier to identify root causes and potential solutions. Each bubble can represent a specific aspect of the problem, with connections illustrating how these aspects interact. This approach not only clarifies the problem but also fosters a structured methodology for addressing it, ensuring that solutions are comprehensive and effective.
By incorporating bubble diagrams into planning, architecture, brainstorming, and problem-solving, individuals and teams can unlock new levels of creativity and efficiency. Whether designing a building or tackling a complex challenge, these diagrams provide a clear pathway from concept to implementation, showcasing the power of visual tools in facilitating communication, innovation, and strategic thinking.

Conclusion
Navigating through the process of creating bubble diagrams involves several critical strategies that enhance their effectiveness in visual representation and communication. Our extensive exploration of bubble diagrams has illustrated their significance in numerous domains, from simplifying complex ideas in planning to fostering creativity in architecture. To master bubble diagrams, we’ll focus on essential strategies such as refining the design process, applying them to real-world scenarios, and optimizing them for enhanced clarity and impact.
Refining the Design Process
Adopting a meticulous approach to the design process is paramount. Begin by clearly defining the objectives and scope of your diagram to ensure that every element added serves a purpose. In brainstorming sessions, prioritize ideas and concepts that align with the project’s goals. Organizing these ideas logically not only improves the diagram’s readability but also its ability to convey complex information succinctly.
Applying Real-World Scenarios
Application in real-world scenarios demonstrates the versatility and utility of bubble diagrams. In architectural planning, for instance, effectively organizing spaces and visualizing user interactions become much more straightforward. Similarly, in project management, bubble diagrams aid in breaking down tasks and visualizing dependencies, streamlining the planning phase.
Optimizing for Clarity and Impact
Finally, enhancing the clarity and impact of bubble diagrams involves several key considerations. Utilizing color coding and annotations can distinguish between different concepts and relationships, making the diagrams more intuitive and accessible. Maintaining simplicity, even in the representation of complex ideas, is crucial to avoid overwhelming the audience.
By adhering to these strategies, we harness the full potential of bubble diagrams in various applications, from project planning to creative brainstorming. Their ability to distill complex information into clear, visual formats is unmatched, making them invaluable tools in strategic thinking and implementation.
- architectural bubble diagrams
- bubble diagram examples
- bubble diagram for design projects
- bubble diagram planning
- bubble diagram software
- bubble diagram techniques
- bubble diagram templates
- bubble diagram tools
- bubble diagram tutorial
- Bubble Diagrams
- bubble diagrams for architecture
- bubble diagrams for interior design
- design bubble diagrams
- how to create bubble diagrams
- landscape design bubble diagrams
- planning with bubble diagrams


Leave a comment