


Table of Contents Show
Before any floor plan takes shape, architects need to answer a fundamental question: which spaces belong together, and which ones should stay apart? Architecture zoning diagrams solve this problem by mapping out functional zones, circulation paths, and programmatic relationships in a visual format that the entire design team can read at a glance.
Whether you are working on a residence or a mixed-use development, a well-built architectural zoning diagram prevents costly layout mistakes and keeps the design aligned with the client’s brief. This guide walks through five main diagram types, explains how to create them, and shares field-tested strategies for turning zone maps into buildable plans.

What Is a Zoning Diagram in Architecture?
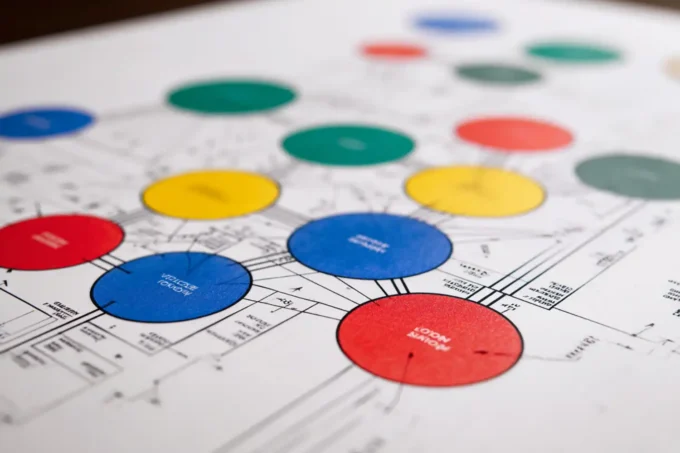
A zoning diagram in architecture is a schematic drawing that groups a building’s spaces into functional categories and shows how those categories relate to one another. Unlike a floor plan, it carries no precise dimensions. Instead, it communicates hierarchy, adjacency, and separation through color coding, bubble sizes, and connector lines.
Think of it as the first translation layer between a written program brief and an actual layout. The architect reads the brief, identifies the required spaces, and organizes them into zones such as public, private, service, and circulation. Each zone gets a color or pattern, and the diagram reveals whether the proposed arrangement supports the intended flow of people and daylight through the building.
Spatial zoning in architecture applies at every scale. At the urban level, zoning maps designate residential, commercial, and industrial districts. At the building level, the same logic helps architects separate a hospital’s emergency department from its administrative wing, or keep a school’s gymnasium away from quiet classrooms. Group related functions, separate conflicting ones, and connect everything with logical circulation.

Why Zoning Diagrams Matter for Space Planning
Space planning architecture relies on zoning diagrams to reduce guesswork early in the design process. According to the American Institute of Architects (AIA), programming and schematic design together consume roughly 15 to 20 percent of an architect’s total project effort. Getting the zoning right during this phase prevents expensive revisions later.
Zoning diagrams offer three specific advantages. First, they force the designer to prioritize function over form. A diagram does not care what the building looks like; it only asks whether the spatial relationships make sense. Second, they serve as a communication bridge. Clients who struggle to read technical drawings can usually follow a color-coded zone map without difficulty. Third, they expose circulation conflicts before walls go up.
For related reading on how circulation paths interact with zoning, see the architecture circulation diagram guide on this site.
5 Types of Architecture Zoning Diagrams
Not every project uses the same format. The type you choose depends on the project phase, the audience, and the program’s complexity. Below are the five most common categories.

Functional Zoning Diagrams
These diagrams sort spaces by their primary use: living, working, sleeping, cooking, storage, and so on. Color blocks or hatched areas represent each function, and adjacency lines indicate which zones need direct connections. A residential functional zoning diagram, for example, might cluster kitchen, dining, and pantry into one zone while keeping bedrooms and bathrooms in another. This is the most straightforward diagram type and usually the first one produced during schematic design.
Circulation and Flow Diagrams
A functional flow diagram architecture project overlays primary, secondary, and service circulation routes on the zone layout. Arrows show direction and volume of movement, with thicker arrows indicating higher traffic. These diagrams are critical for public buildings such as airports, hospitals, and schools, where separating visitor flow from staff corridors directly affects safety.
Public-Private Gradient Diagrams
This type arranges zones along a spectrum from fully public to fully private. A museum might progress from the public lobby through semi-public galleries, into staff-only conservation labs, and finally to secure storage. Plotting this gradient on a single diagram helps verify that privacy increases logically as you move deeper into the building. Learn more about how bubble diagrams support interior zoning decisions.

Environmental Zoning Diagrams
Environmental diagrams map zones based on daylight access, acoustic requirements, thermal comfort, or ventilation needs. According to guidelines published by ASHRAE, grouping spaces with similar thermal loads can reduce HVAC system complexity. An environmental zoning diagram might place south-facing zones for passive solar gain while locating server rooms on the cooler north side.
Programmatic Zoning Diagrams
Programmatic diagrams translate the written program into proportional zones. Bubble sizes or block areas correspond to the actual area each space needs. This type bridges the gap between the program document and the physical floor plan, making it a key step in creating bubble diagrams for architectural projects.
Comparison of Architecture Diagram Types
The following table highlights the key characteristics, ideal project stages, and typical applications for each diagram type.
| Diagram Type | Primary Focus | Best Project Stage | Typical Application |
|---|---|---|---|
| Functional Zoning | Activity grouping | Schematic design | Residential, small commercial |
| Circulation and Flow | Movement patterns | Schematic to design development | Hospitals, airports, schools |
| Public-Private Gradient | Access and privacy levels | Programming to schematic | Museums, offices, embassies |
| Environmental | Daylight, acoustics, thermal | Concept to schematic | Sustainable and passive design |
| Programmatic | Area allocation | Programming | Mixed-use, institutional |
How to Create a Zoning Diagram Step by Step
Creating an architecture zoning diagram does not require advanced software. Many architects start with tracing paper and colored markers, then move to digital tools for refinement.
Start by listing every space from the program brief, including target area, required adjacencies, and special conditions (noise isolation, natural light, direct exterior access). Next, group spaces into logical clusters. A school program might yield clusters for classrooms, administration, sports, dining, and building services. Assign a distinct color to each cluster.
Sketch the zones as rough shapes or bubbles, sized proportionally to their total area. Place zones that need adjacency close together, and keep conflicting zones apart. Draw connector lines between zones that require direct access. Finally, overlay primary circulation routes and check whether users can move from entry to each major zone without crossing service areas.
For a deeper walkthrough of bubble-based planning, the step-by-step bubble diagram guide covers techniques applicable to zoning diagrams as well.

Tools and Software for Zoning Diagrams
Hand sketching remains the fastest way to test zoning ideas. Tracing paper, colored pencils, and a fat marker are enough for the first round. Once a preferred arrangement emerges, digital tools help refine and share the diagram.
AutoCAD and Revit both support zoning overlays through color-filled regions or area plans. Figma and Adobe Illustrator allow drag-and-drop zone creation with easy color management. SketchUp works well for three-dimensional zoning studies in multi-story projects. GIS platforms such as QGIS are more relevant at the urban planning scale, where zoning architecture decisions interact with land-use regulations.
The Royal Institute of British Architects (RIBA) Plan of Work identifies spatial zoning as a core activity during Stage 2 (Concept Design). Regardless of the tool, the goal at this stage is speed and clarity, not precision drafting.
Applying Zoning Diagrams to Real Projects
Consider a mid-size medical clinic. The program calls for a reception area, examination rooms, a procedure suite, staff offices, and building services. A functional zoning diagram would color-code these into four zones: public, clinical, administrative, and service.
Layering a circulation diagram on top immediately shows that patients should flow from reception to examination rooms without passing through the procedure suite. Staff need a separate corridor connecting clinical and administrative zones. If the diagram reveals overlapping routes, the architect adjusts zone placement before drawing a single wall.
In residential projects, the same logic applies at a smaller scale. A zoning diagram for a house might separate the social zone (living, dining, kitchen) from the private zone (bedrooms, bathrooms) with a transitional hallway. The service zone (laundry, garage) connects to both but remains acoustically isolated. This approach is the foundation of space planning architecture at every project size.

Common Mistakes to Avoid
Even experienced designers sometimes fall into zoning traps. The most frequent error is skipping the diagram entirely and jumping straight to floor plans. Without a zoning study, the architect risks locking in a layout that works geometrically but fails functionally.
Another mistake is treating the zoning diagram as a finished product rather than a working tool. Diagrams should be loose, fast, and disposable. If a version takes more than 30 minutes to produce, it is probably too detailed for this stage. A third error is ignoring vertical zoning in multi-story buildings. Stacking compatible zones (office over office, service over service) simplifies structural and mechanical systems. Placing a gymnasium above a library creates noise problems that expensive treatments may not fully resolve.
For further insight into how architectural diagrams connect to later design phases, explore the full architecture zoning diagrams topic page on this site.


Leave a comment