


Table of Contents Show
Bubble diagrams serve as an essential planning tool for architectural design. These simple yet powerful tools help us visualize spatial relationships and create a strong foundation for our projects. They’re not just sketches; they’re the first step in bringing our ideas to life.
Designing a bubble diagram might seem overwhelming at first, but it’s all about organizing thoughts and defining how spaces connect. By focusing on flow, function, and hierarchy, we can ensure our projects are both practical and inspiring. Whether it’s a home, office, or public space, a well-crafted bubble diagram sets the stage for success.
Let’s dive into the essentials of creating a bubble diagram that works. With a little guidance and creativity, we can transform abstract concepts into a clear, cohesive layout that brings our architectural vision to reality.
What Is A Bubble Diagram?

A bubble diagram is a conceptual tool used in architectural design to represent spatial relationships and flow within a project. It uses simple circles or ovals, often labeled with room names or functions, to visualize how different spaces connect and interact. By focusing on proximity, scale, and hierarchy, it helps establish the layout and functional relationships without delving into intricate details.
We use these diagrams to map out ideas early in the design process, ensuring clarity and alignment with project goals. Each bubble’s size may convey relative importance or space requirements. Lines or arrows between bubbles indicate functional adjacencies, movement patterns, or shared utilities.
Bubble diagrams streamline decision-making by identifying potential challenges and opportunities before developing detailed plans. They’re versatile, supporting projects ranging from residential layouts to complex commercial or institutional designs.
Importance Of Bubble Diagrams In Architecture

Bubble diagrams simplify complex design processes by visualizing spatial relationships early in a project. They enable us to explore layout concepts, ensuring efficient use of space and alignment with project requirements. By focusing on functional adjacency and flow, these diagrams reduce errors in later stages by clarifying spatial intent.
Bubble diagrams enhance collaboration among teams by serving as a visual communication tool. Their simplicity allows architects, clients, and stakeholders to share and refine ideas effectively. This minimizes misconceptions and streamlines decision-making.
Flexibility is another critical benefit of bubble diagrams. Because they’re non-technical, adjustments can be made quickly based on feedback, evolving needs, or budget constraints. We can use them to test multiple scenarios without committing to detailed plans.
In multidisciplinary projects, bubble diagrams improve integration between architecture and other systems. They help us coordinate layouts with mechanical, electrical, and structural components early, reducing coordination issues later.
Steps To Design A Bubble Diagram For Your Architectural Project
Designing an effective bubble diagram requires a clear understanding of project goals and systematic organization of space. Follow these steps to visualize and refine spatial relationships for your architectural project.
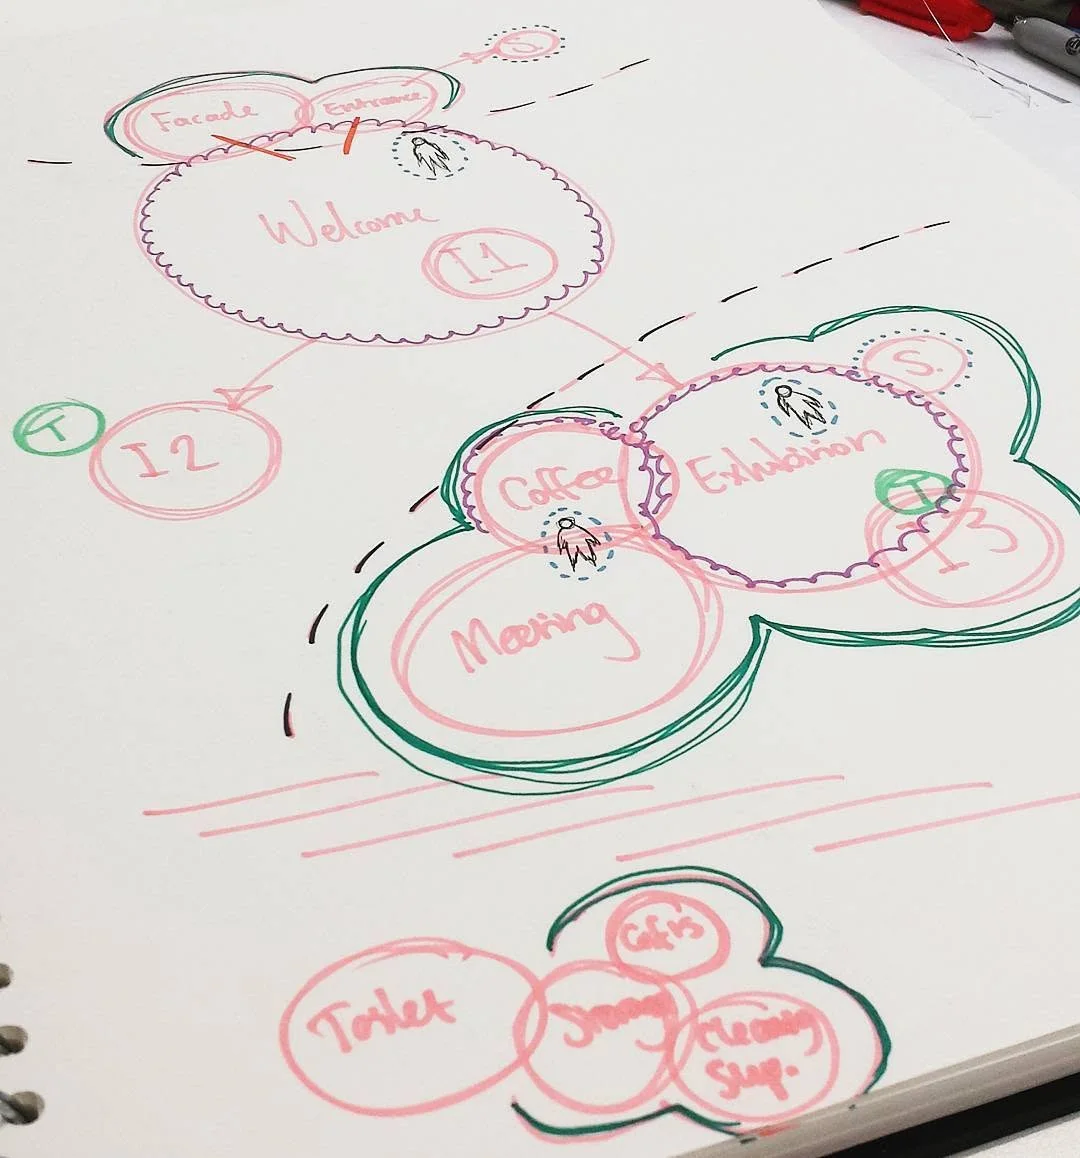
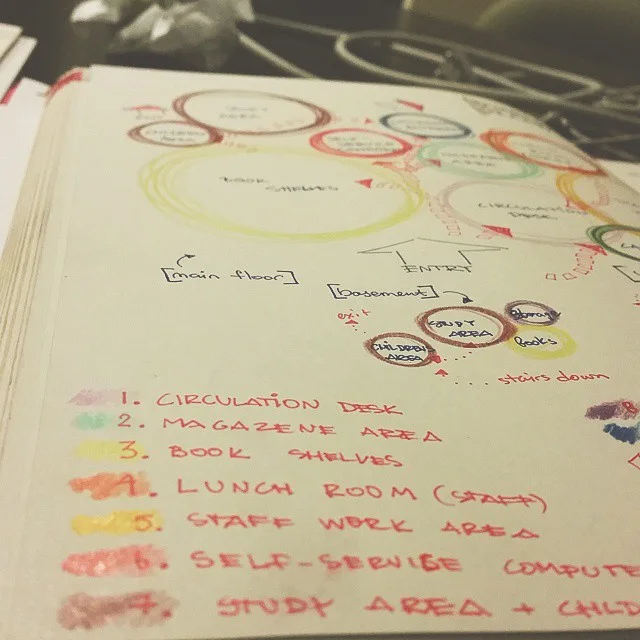

Understanding Project Requirements
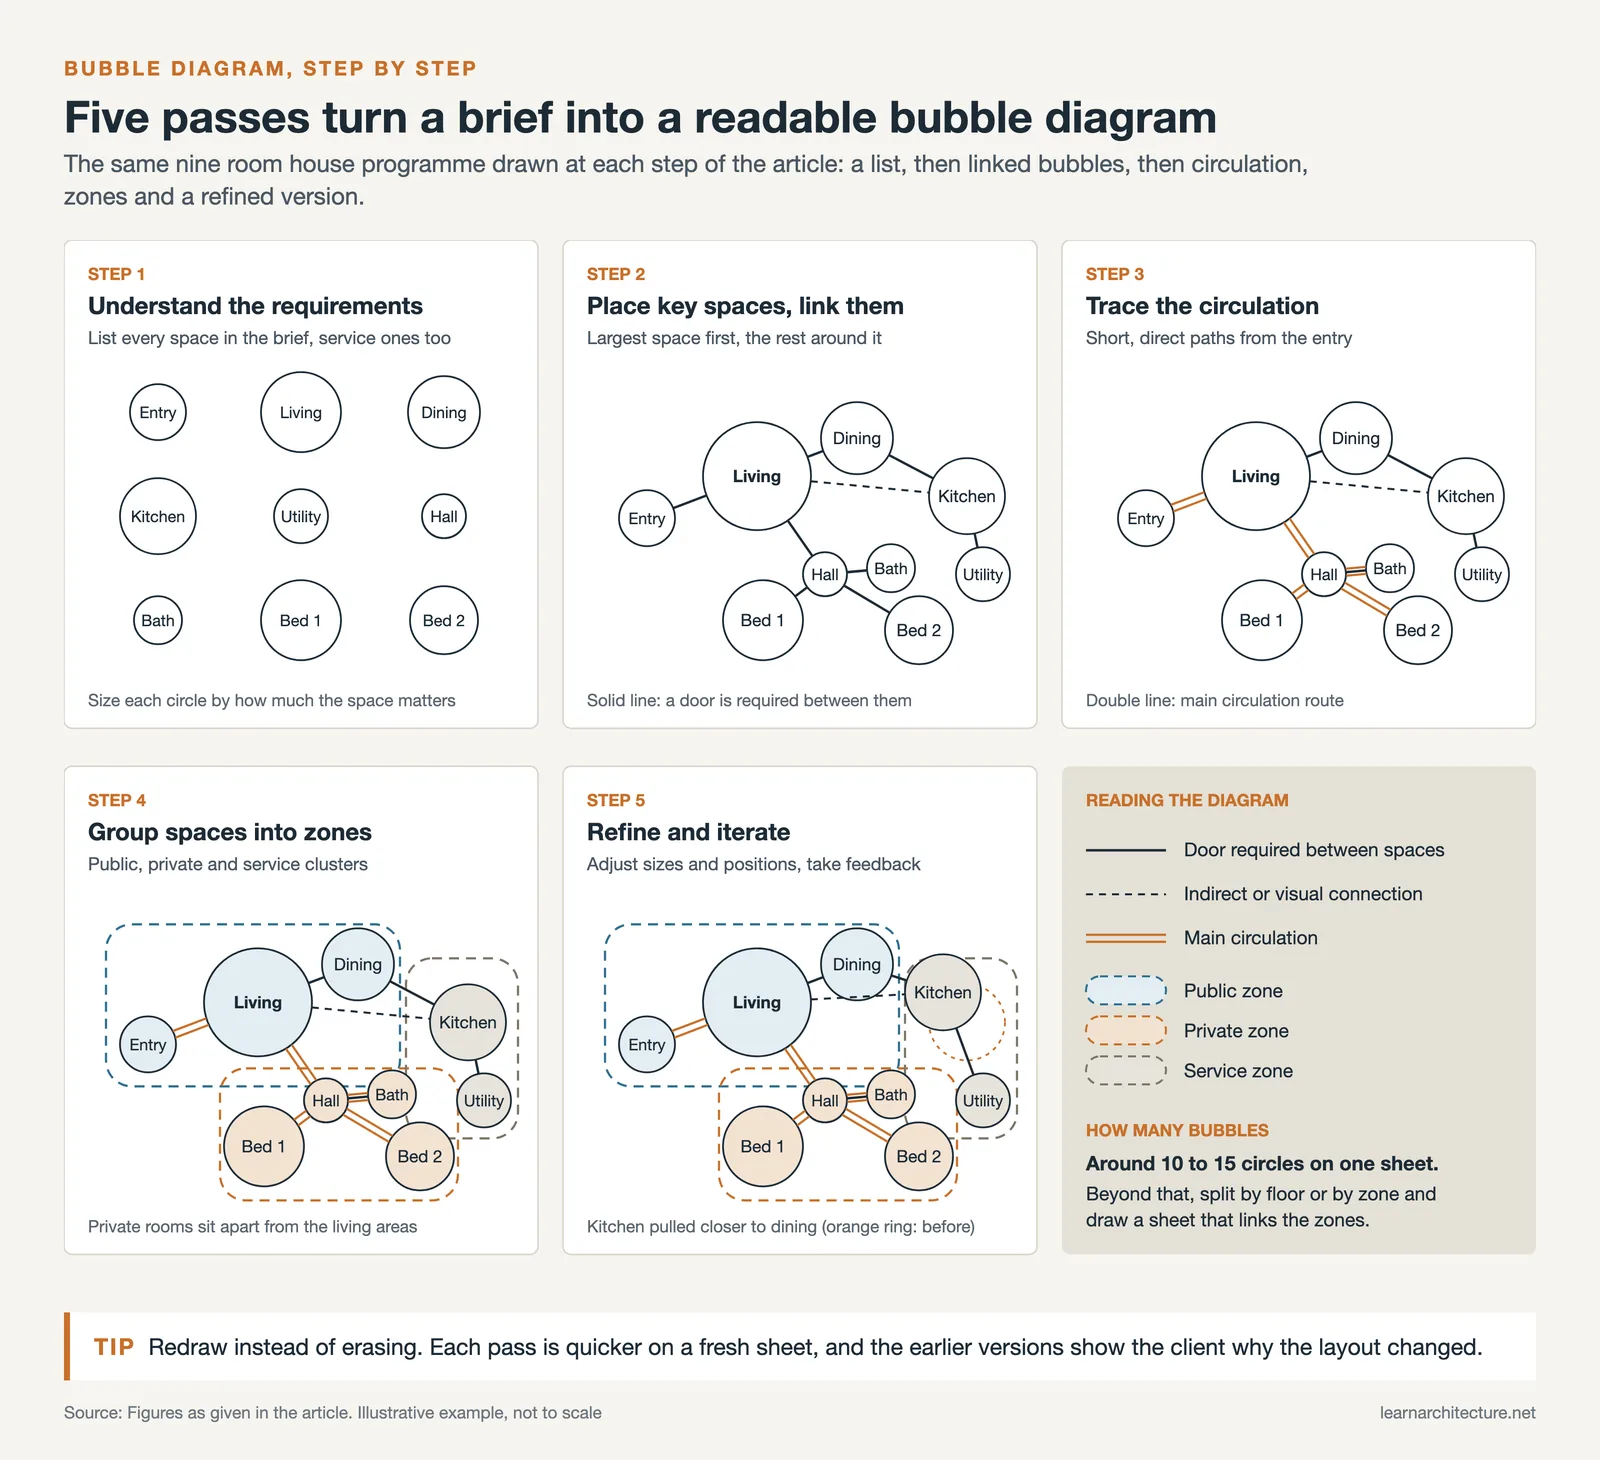
We start by identifying the project’s functional goals, constraints, and user needs. This includes gathering information on the number of spaces, specific functions, and any unique requirements. For example, residential projects may prioritize comfort and privacy, while commercial designs focus on efficiency and accessibility.
Identifying Key Spaces And Relationships
We determine primary spaces and their relationships based on programmatic needs. Key spaces, such as living rooms or office hubs, should be prioritized in the layout. Next, we define functional adjacencies, like proximity between kitchens and dining areas, or between conference rooms and work zones, ensuring a logical flow.
Establishing Circulation Paths
We map out how users move between spaces to create natural circulation patterns. Paths should minimize unnecessary travel distances and avoid congestion points. For instance, in a residence, hallways connecting bedrooms to bathrooms should be direct and unobstructed.
Grouping And Zoning Spaces
We cluster related spaces into functional zones based on usage. For example, private areas, such as bedrooms, are grouped separately from public spaces, like living rooms. Proper zoning improves functionality and ensures an intuitive layout.
Refining And Iterating The Diagram
We refine the diagram by adjusting bubble sizes, shapes, and positions to achieve balance and coherence. Incorporating feedback from stakeholders helps address overlooked project needs. Iterative adjustments ensure the final diagram aligns with both project goals and spatial requirements.
Tools And Techniques For Creating Bubble Diagrams
Efficient tools and methods streamline the creation of bubble diagrams, catering to diverse project requirements. Both manual and digital approaches offer distinct advantages, depending on project scope and designer preferences.

Manual Drawing Techniques
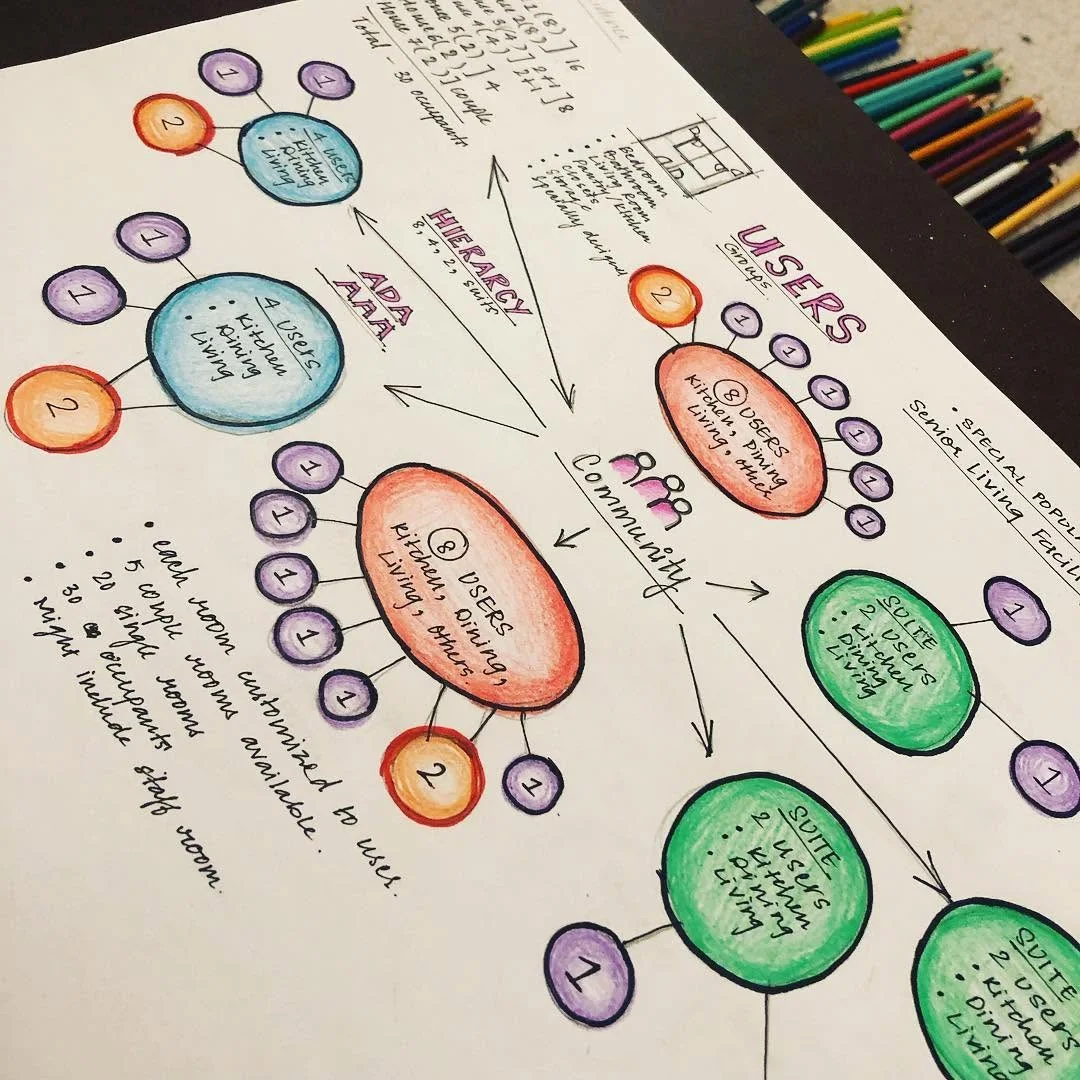
Sketching with pen and paper provides flexibility in exploring initial ideas. By starting with blank sheets, we can freely experiment with bubble sizes and layouts without restrictions. Using colored markers or pencils enhances clarity, with each color representing specific zones, flow paths, or design elements. Hand-drawn diagrams simplify rapid modifications, making them highly useful during brainstorming sessions or collaborative discussions.
Grids or templates improve consistency in proportional spacing. Pre-drawn circles or stencils can also assist in maintaining uniformity while keeping focus on spatial relationships. These methods are particularly beneficial for small-scale or conceptual projects where quick iterations are necessary.
Digital Tools And Software
Digital tools enhance precision and adaptability in bubble diagram creation. Applications like AutoCAD, Adobe Illustrator, and SketchUp provide scalable features to design detailed layouts. We can adjust bubble sizes, add labels, and experiment with various connections efficiently. Software like Lucidchart or ConceptDraw offers specialized functions for visualizing relationships using drag-and-drop elements.
Cloud-based platforms increase collaboration in multidisciplinary teams. Real-time updates allow multiple contributors to propose changes simultaneously, ensuring alignment across departments. Additionally, digital tools support integration with other design software, helping us transition seamlessly from preliminary diagrams to detailed architectural plans.
Bubble Diagram And Zoning Diagram: What Is The Difference?
The difference between a zoning diagram and a bubble diagram is resolution. A zoning diagram divides a project into broad territories, public, private and service, and stops there. It answers which part of the building does what. A bubble diagram takes those territories and breaks them into named spaces, then draws the connections between them. It answers which room sits beside which, and how people get there.
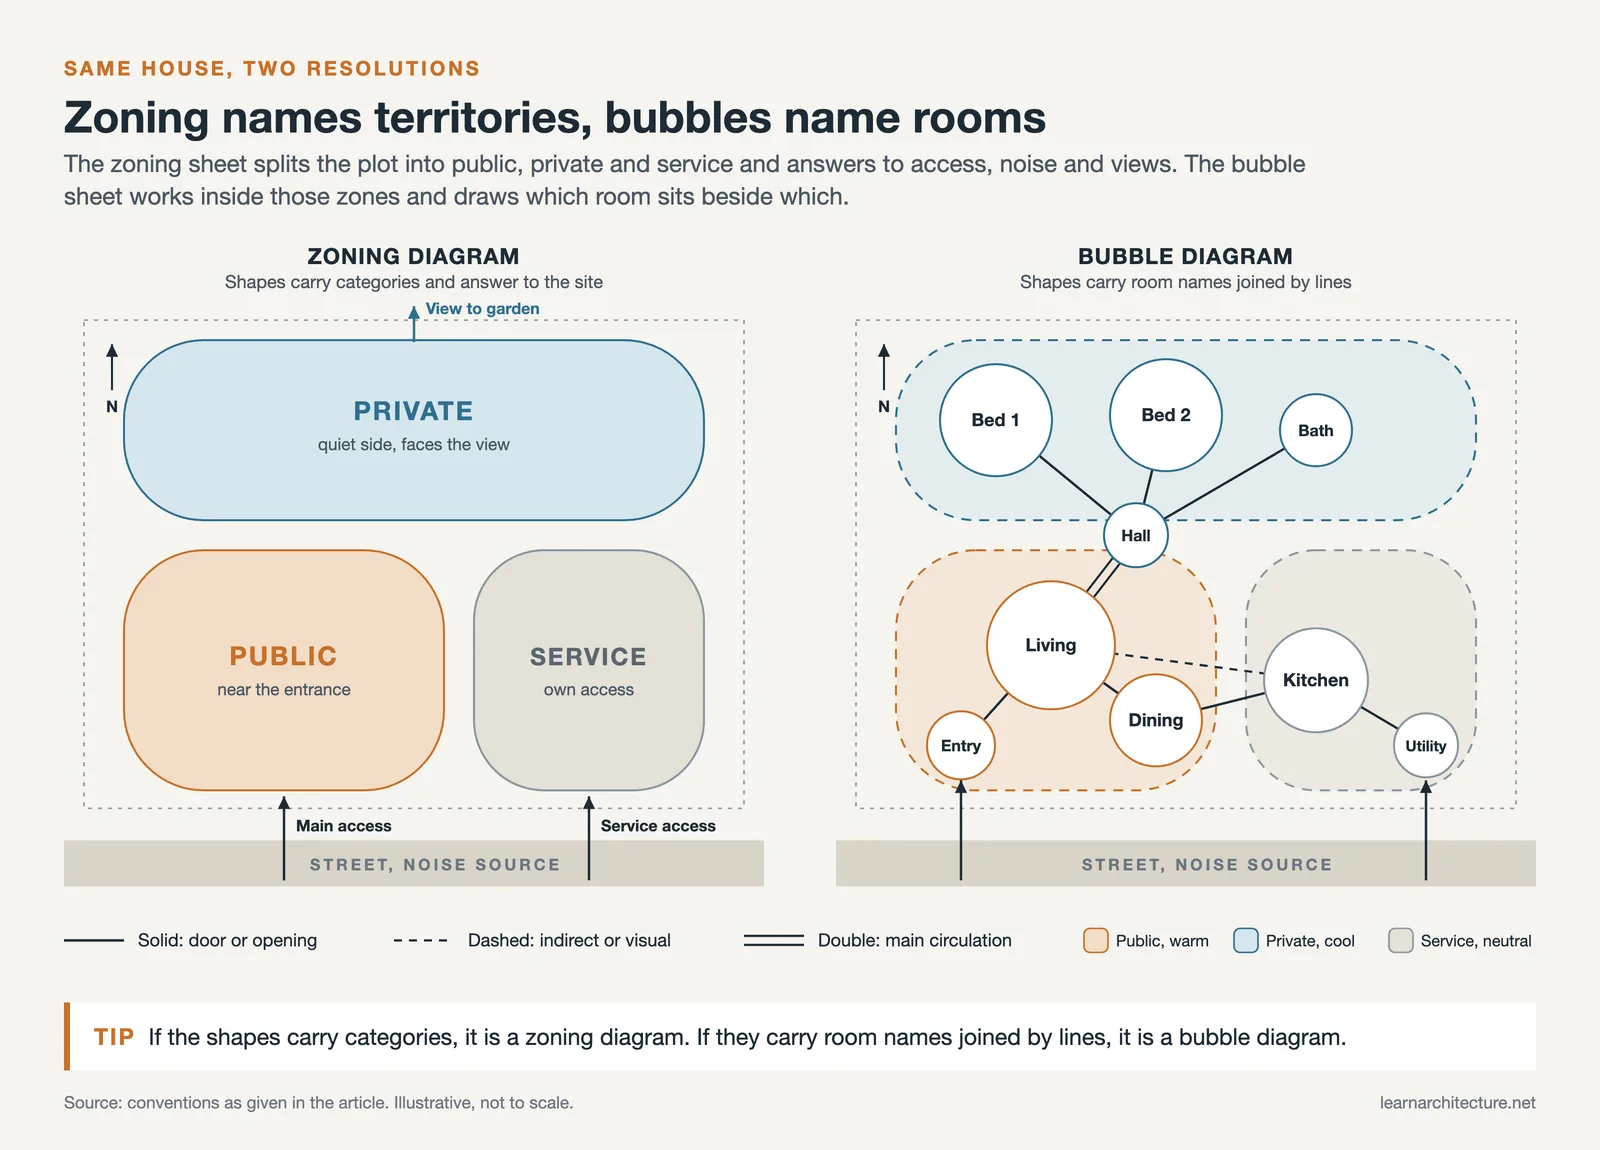
The two also sit at different moments. Zoning usually comes first and responds to the site: orientation, access, noise and views. Bubble diagramming follows, working inside the zones that zoning established. Skipping zoning tends to produce bubble diagrams that ignore the site; stopping at zoning never tests whether the programme actually fits.
A quick way to tell them apart in a drawing: if the shapes carry categories, private or service, it is a zoning diagram. If they carry room names joined by lines, it is a bubble diagram.
Bubble Diagram Symbols And Legend
There is no universal standard, but most architects follow the same visual language, and using it consistently is what makes a diagram readable to someone else.
- Large circles for primary spaces: living areas, lobbies, main halls.
- Medium circles for secondary spaces: bedrooms, offices, meeting rooms.
- Small circles for service: bathrooms, storage, plant.
- Solid lines where a direct physical connection is required, meaning a door or opening.
- Dashed lines for indirect or optional relationships, including visual connections.
- Double lines for main circulation, such as a corridor or spine.
- Colour coding by zone: warm tones for public areas, cool tones for private, neutral for service.
Add a short legend to the sheet. Clients who have never seen the convention read circles literally, as round rooms or as final sizes, and a single line of explanation prevents most of that confusion.
Free Bubble Diagram Templates To Download
Two sheets you can print and work on directly. Both are A4 landscape PDFs, free to use on student and professional projects, no sign-up.

Bubble Diagram Symbols & Legend Sheet (PDF)
Every convention described above on one page: circle sizes for hierarchy, the three line types, colour coding by zone, and a blank legend box to copy onto your own sheet. Pin it up while you draw.

Adjacency Matrix Blank Worksheet (PDF)
The step most people skip. List the programme down the left, rate every pair once against the four-mark key, then count the required connections. Whatever scores highest is your circulation anchor, and that becomes the largest circle. Fill this in before you draw anything.
Both sheets are free to print and share. If you use them in teaching, a credit back to this page is appreciated.
Bubble Diagram Examples By Building Type
The method stays the same, but what drives the arrangement changes with the brief.

Residential
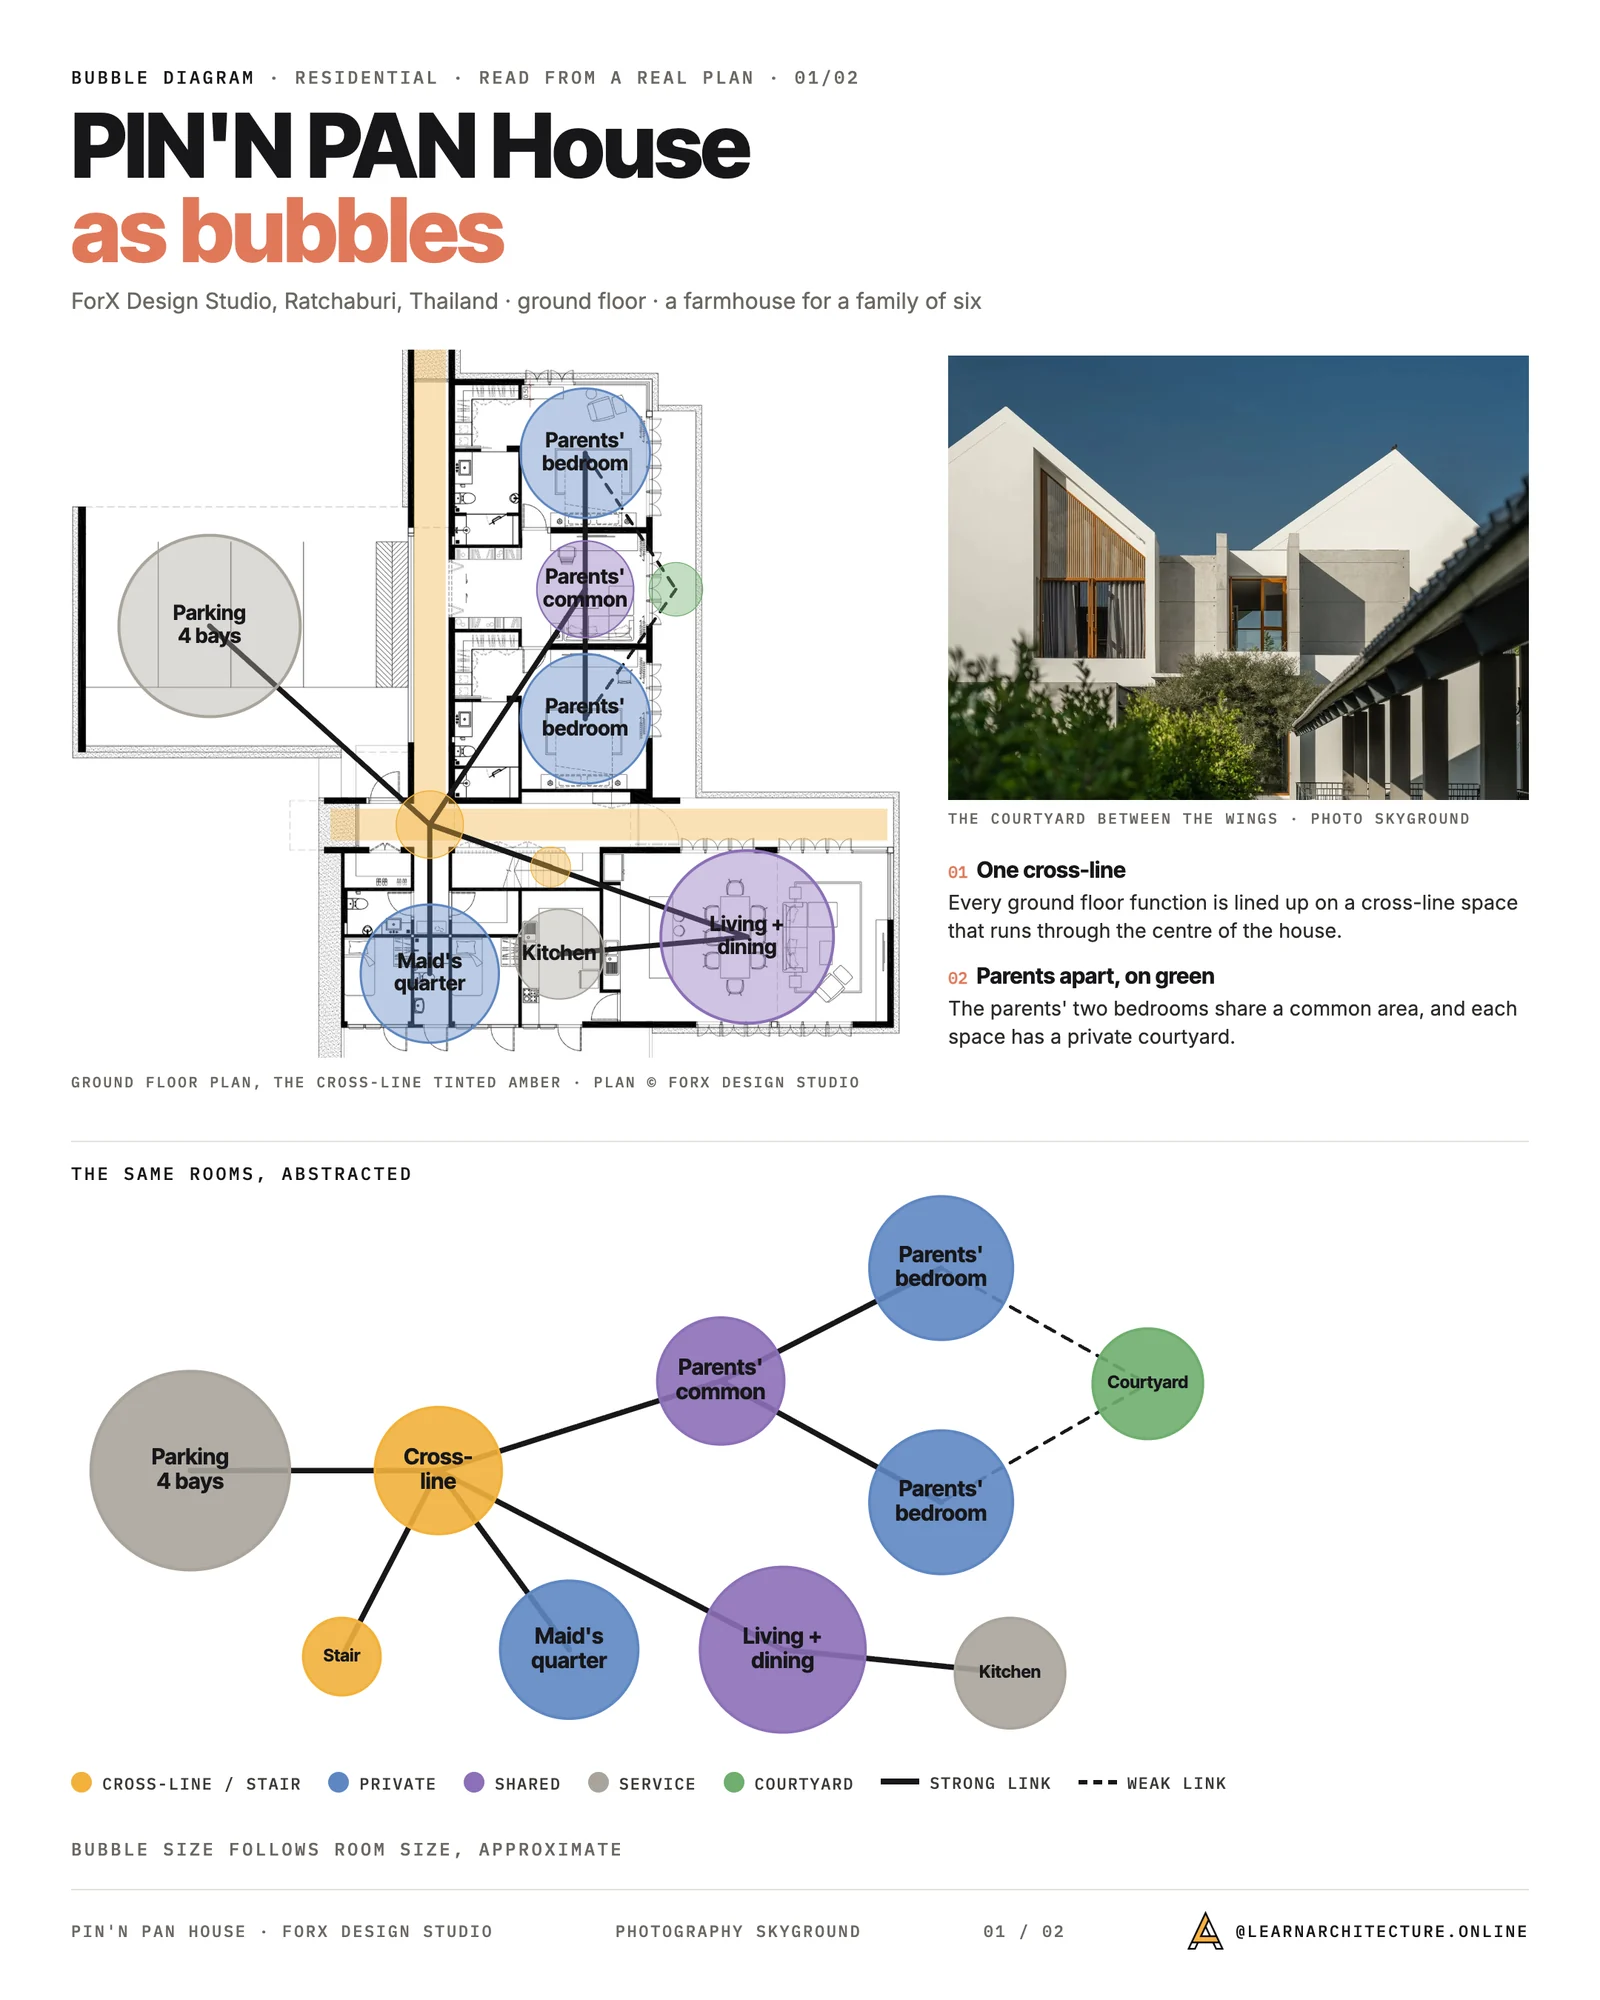
Organise around the split between social and private. The entry connects to living and dining; bedrooms sit behind a buffer, ideally a corridor or storage wall rather than a shared partition. Kitchen wants proximity to dining and to the outdoor area; the utility room wants proximity to the kitchen and to a service door.
Restaurant
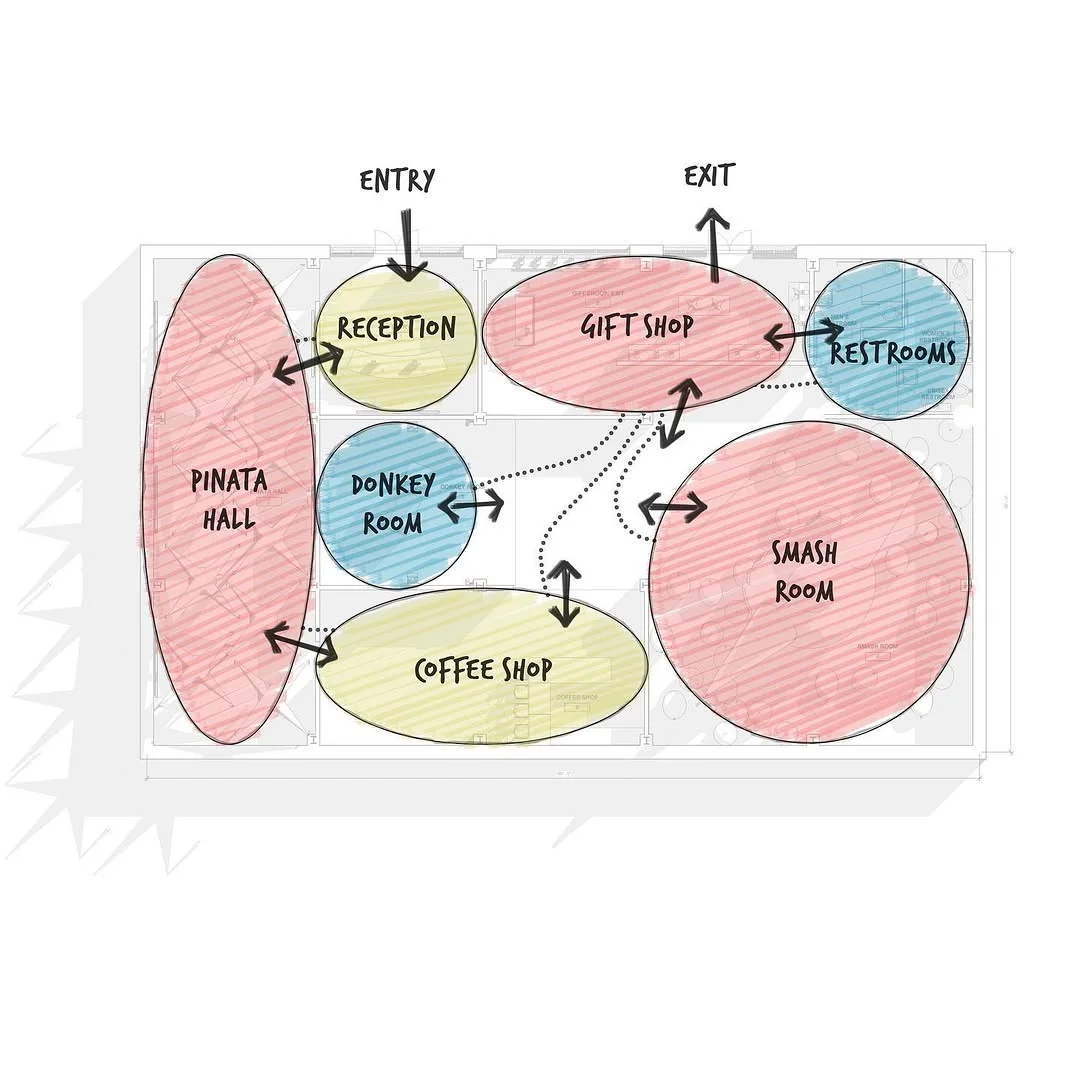
The governing split is front of house against back of house, and every point where the two touch needs a door, a screen or a change of level. Deliveries and refuse must reach the kitchen without crossing the dining room. Toilets belong where they are reachable from the dining area without passing the service route.
Hotel
Guest circulation and staff circulation run as two separate networks that meet only at controlled points. Public functions, reception, bar and restaurant, cluster near the entrance; rooms stack above on a repeating floor plate. Housekeeping and servicing need a vertical route that never appears in the guest sequence.
Office
Plan the acoustic gradient rather than the desks. Social and collaborative space sits near the entry, focused work further in, and meeting rooms take the perimeter only if daylight is not needed more urgently elsewhere. The gradient between loud and quiet is the actual design problem.
School
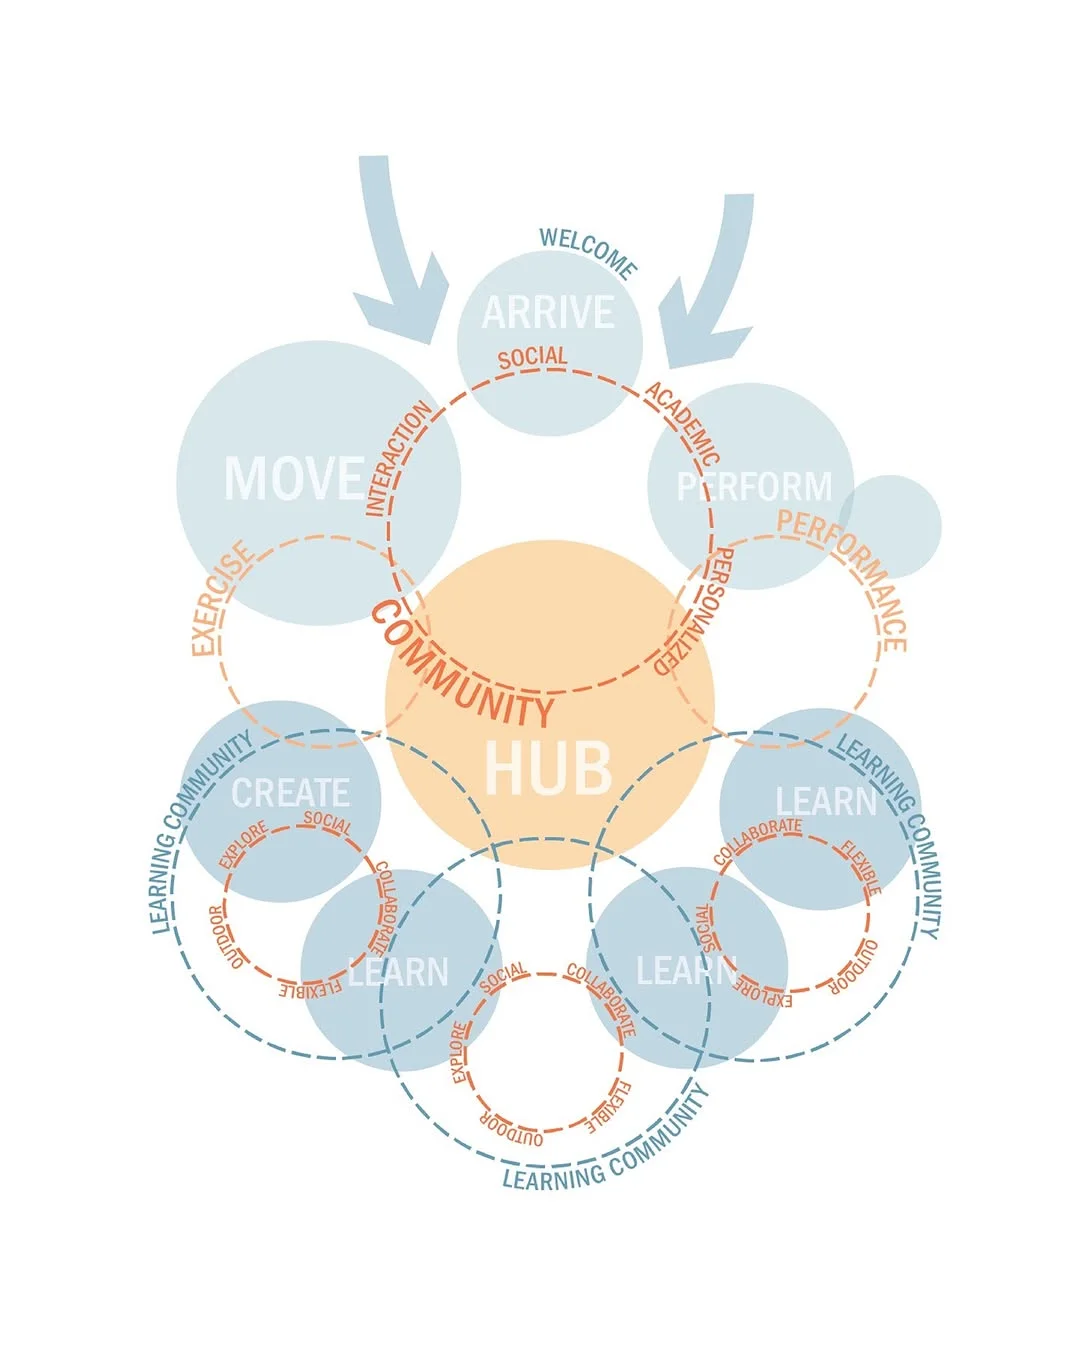
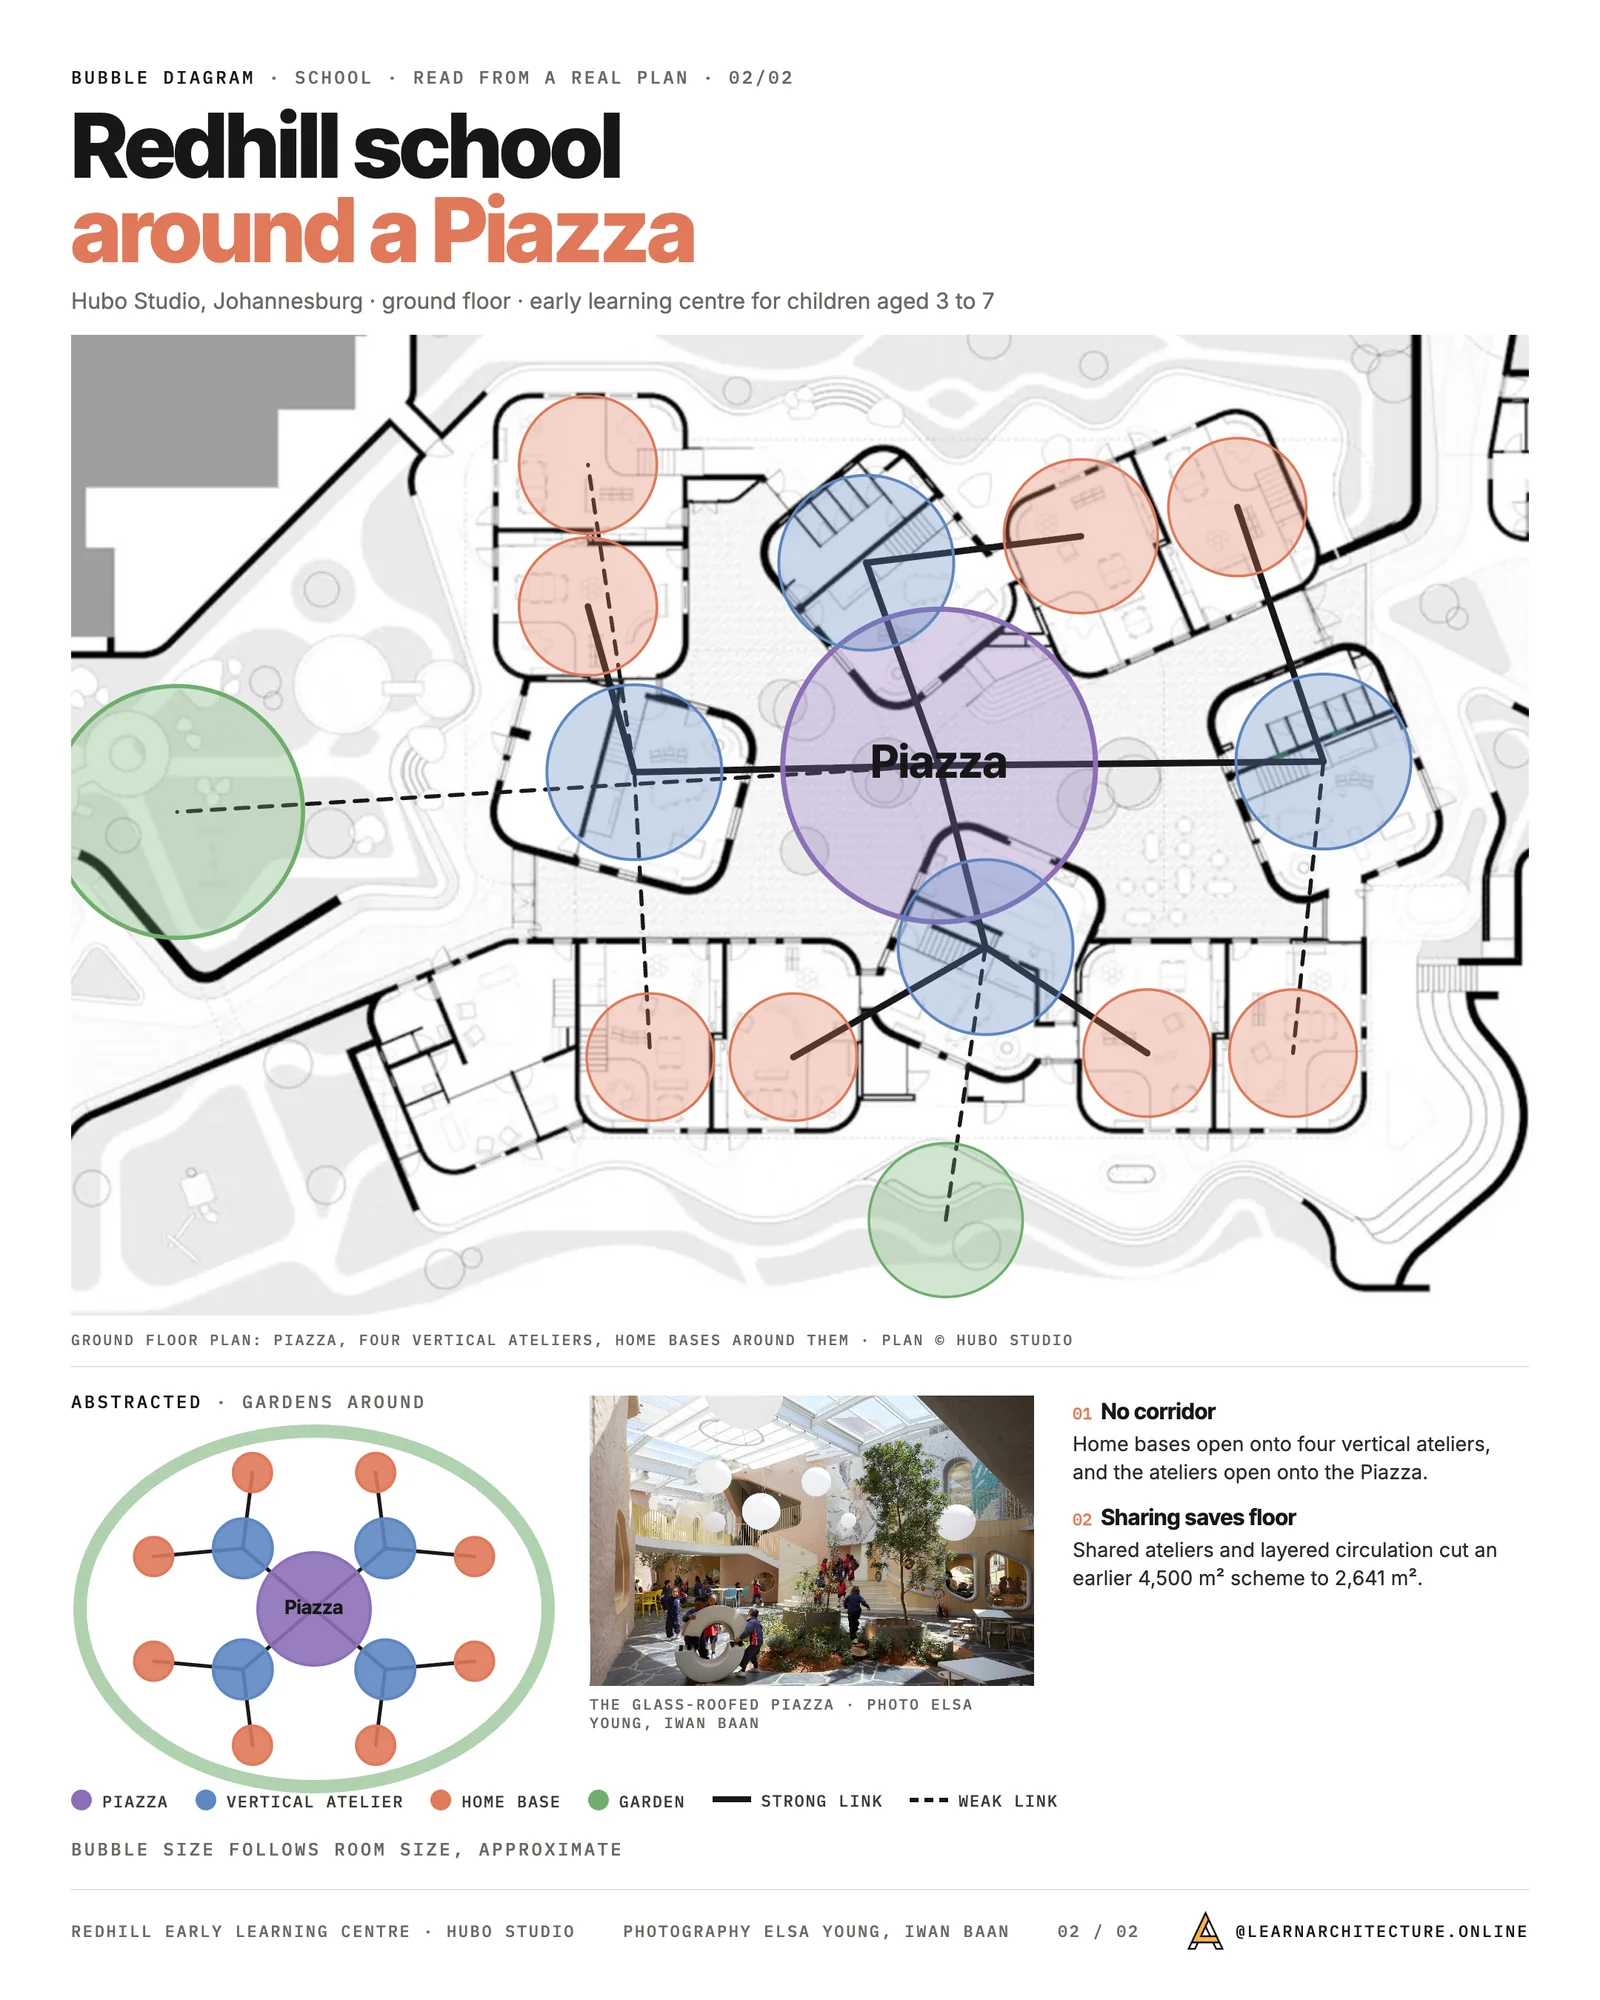
Teaching spaces group by age and by noise. Music, workshops and sports separate from classrooms and the library. Shared facilities, hall and canteen, sit where they can be reached from teaching areas and also opened to the public out of hours without exposing the rest of the building.
Should You Use A Bubble Diagram Template?
A template gives a starting arrangement for a common building type and saves the tedious part, which is remembering every service space. It also carries adjacencies that have already been tested on real projects.
The risk is that a template answers a brief you were not given. Use one as a checklist so nothing is missing, then rearrange it against your own site and programme. A template that survives contact with the project unchanged usually means the project was not examined closely enough.
If you want one to start from, the two free sheets above are built as checklists rather than finished layouts: a symbols and legend reference, and a blank adjacency matrix.
Tips For Creating Effective Bubble Diagrams
Crafting a bubble diagram requires precision and focus to ensure it serves its purpose in architectural design. These tips cover key aspects for creating diagrams that align with project goals and enhance overall design workflow.

Maintaining Flexibility
We design bubble diagrams as flexible tools to explore various spatial layouts and concepts. To maintain adaptability, we recommend creating multiple iterations that test different spatial relationships and circulation patterns. Using erasable markers or digital tools ensures quick modifications. Flexibility supports experimentation and fosters creativity, leading to better organization of spaces.
Prioritizing Functionality
Functionality drives the effectiveness of a bubble diagram. Start by identifying critical spaces, such as kitchens or conference rooms, and their specific needs. Group related areas, maintain logical adjacencies, and emphasize efficient circulation flow. For instance, placing storage areas near work zones can streamline operations. Always ensure the design aligns with end-user requirements.
Avoiding Common Mistakes
Common mistakes, like overcrowding or ignoring scale, can reduce a bubble diagram’s clarity. We suggest limiting the number of bubbles to represent only key spaces and using proportional sizing to reflect accurate spatial needs. Avoid overly rigid layouts, as they may hinder flexibility during the design process. Misplaced adjacencies, such as isolating shared amenities, should also be resolved early in the diagram stage to prevent inefficiencies.
Frequently Asked Questions About Bubble Diagrams
What is a bubble diagram in architecture?
A bubble diagram is a freehand or digital schematic that represents each space in a brief as a circle, and each required relationship between spaces as a line. Circle size shows hierarchy rather than area, and position shows relationship rather than geometry. Nothing on it is measured; that is deliberate, because it lets you test how a building wants to be organised before committing to walls.
How do you make a bubble diagram, step by step?
List every space in the brief, including the service spaces that get forgotten. Rate how the spaces relate to each other, ideally on an adjacency matrix. Draw the highest-scoring space as the largest circle and place the rest around it. Add solid lines where a door is required, dashed lines for indirect or visual connections, and double lines for main circulation. Group the circles into zones, then redraw. The step-by-step section above covers each stage in full.
What is the point of a bubble diagram if nothing is measured?
Because being unmeasured is the point. Once a plan has dimensions, every change is expensive to test. A bubble diagram costs a few minutes, so you can reorganise the whole building five times in an afternoon and find the conflicts, the awkward circulation and the missing spaces while it is still cheap to fix them.
What is the difference between a bubble diagram and a zoning diagram?
A bubble diagram works at the level of individual spaces and the connections between them. A zoning diagram works one level up, grouping spaces into larger territories such as public, private and service, and often relating them to the site. In practice the two work together: zoning sets the broad territories against the site, and the bubbles resolve the individual spaces inside them. The comparison section above sets out both in detail.
How do you use a bubble diagram for interior design?
The method is identical, only the scale changes. Instead of buildings and wings, the circles are rooms and furniture groups, and the lines carry sightlines, daylight and acoustic separation as much as physical doors. Interior briefs tend to have more avoid relationships than architectural ones, so mark those conflicts first.
What software should I use to make a bubble diagram?
For the first pass, paper and a pen beat any software, because the point is to draw badly and fast. When you need something presentable, general vector tools such as Illustrator, Affinity Designer, Figma or even PowerPoint are enough, and several online bubble diagram makers will do it in a browser. The tools section above compares the manual and digital routes.
Are bubble diagrams still relevant when you work in BIM?
Yes, and arguably more so. BIM makes it very easy to model a bad organisation in great detail. A bubble diagram is the cheap check that happens before any of that: it settles what should be next to what, so the model starts from a considered arrangement instead of an accidental one.
How many spaces should a bubble diagram show?
Enough to be complete, few enough to read. Around ten to fifteen circles on one sheet is comfortable; beyond that, split the diagram by floor or by zone and draw a second sheet showing how those zones connect. A diagram nobody can read has stopped doing its job.
Conclusion
Designing a bubble diagram integrates creativity with strategic thinking, turning abstract concepts into structured layouts. By aligning spatial relationships, defining circulation patterns, and prioritizing functionality, we streamline the design process and mitigate potential challenges. Leveraging tools and iterative approaches, whether manual or digital, ensures precise and adaptable outcomes suited to diverse project requirements.
Our focus remains on simplifying complexities, enhancing collaboration, and fostering effective communication among teams. Bubble diagrams aren’t merely planning tools; they’re foundational elements for achieving cohesive architectural designs.
- architectural design guide
- architectural planning tools
- architectural project workflow
- Architecture design process
- architecture design tools
- architecture project design
- architecture project diagramming
- architecture project planning
- bubble diagram architecture
- bubble diagram creation
- bubble diagram examples
- bubble diagram for architects
- bubble diagram techniques
- bubble diagram tutorial
- creating bubble diagrams
- design a bubble diagram
- design bubble diagram step-by-step
- guide to architectural diagrams
- how to make a bubble diagram
- introduction to bubble diagrams
- step-by-step architectural design












Leave a comment