


Table of Contents Show
Architectural site analysis is the structured process of studying a location’s physical, environmental, and social conditions before any design work begins. It turns raw land into readable data, giving students and architects the evidence they need to make design decisions that respond to real conditions rather than assumptions.
Every strong building starts with a strong reading of its site. For architecture students, architectural site analysis can feel overwhelming because it touches so many disciplines at once: geography, climate science, urban planning, sociology, and law. The good news is that the process follows a clear sequence. Once you learn that sequence, you can apply it to any project, from a small residential plot to a large urban redevelopment. This guide walks through seven practical steps, from desk research to final diagram production, so you can approach your next studio project with confidence.

What Is Site Analysis in Architecture?
Site analysis is a pre-design research phase that inventories and evaluates the conditions on and around a project site. The goal is to identify constraints (steep slopes, flood zones, easements) and opportunities (views, prevailing breezes, existing vegetation) that will drive the design. The output is typically a set of annotated diagrams and a written summary that the design team references throughout the project. For a deeper look at how this phase fits into the broader design workflow, see this introduction to architecture site analysis.

Step 1: Collect Pre-Visit Data
Before setting foot on the site, pull together every piece of existing information you can find. Start with the site’s legal boundaries, cadastral records, and zoning designation. Municipal planning departments usually publish these online. Next, download satellite imagery and topographic maps from Google Earth or your country’s national mapping agency. These give you a baseline understanding of elevations, surrounding land use, and access roads.
Check local building codes and setback requirements early. A design that ignores a 6-meter rear setback will need a full rework later. Also look for utility easements, heritage overlays, and environmental protection zones that restrict what you can build and where.
💡 Pro Tip
Create a folder structure on your computer before you start collecting data: one subfolder each for legal documents, maps, climate data, and photos. Students who skip this step often waste hours searching for files mid-project when a tutor asks a question about zoning or drainage.
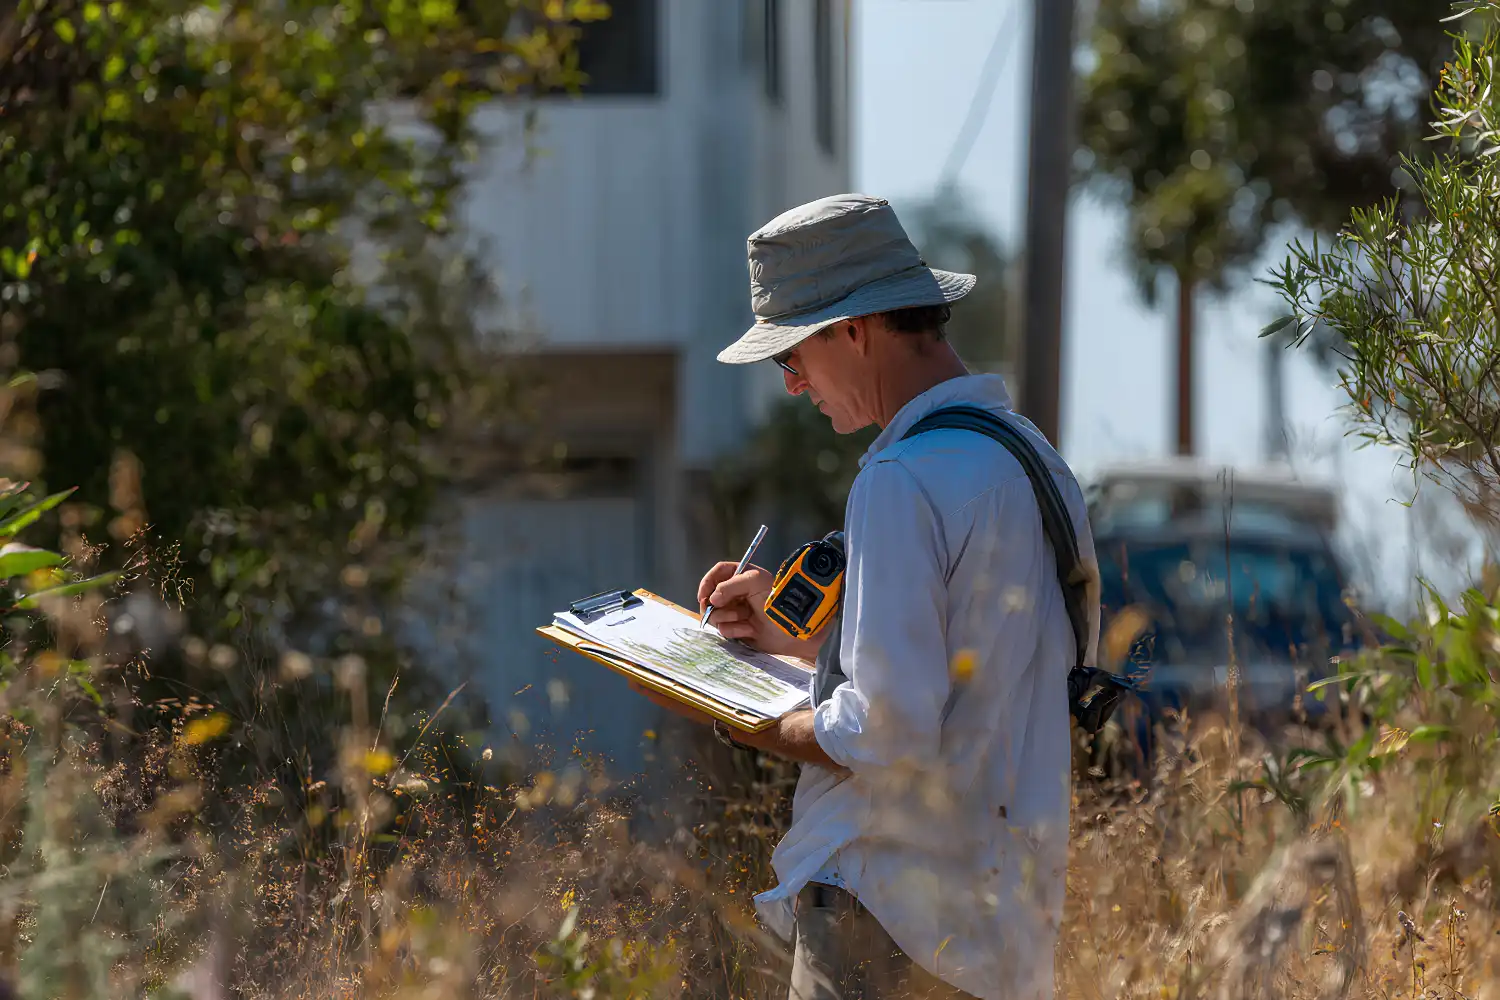
Step 2: Conduct the Site Visit
No amount of desk research replaces walking the ground. Visit the site at least twice, ideally at different times of day, so you can observe how sunlight, traffic, and pedestrian activity change. Bring a camera, a sketchbook, a compass (or a compass app), and a measuring tape.
Record the following during your visit: slope direction and approximate gradient, noise levels from nearby roads or industry, existing vegetation (species if you can identify them, otherwise size and canopy spread), views worth preserving or screening, and the general condition of adjacent buildings. Sketch quick section profiles through the site to capture elevation changes that satellite images flatten out.
What Should You Observe During a Site Visit?
Focus on sensory information that cameras miss. Feel which direction the wind comes from. Notice where puddles form after rain, because those low points signal drainage issues. Listen for background noise that could affect building orientation. Watch where pedestrians naturally cut across the site, since those desire lines often suggest where paths or entrances should go. These observations feed directly into your key factors analysis later.
Step 3: Map Environmental Factors
Back at your desk, layer the environmental data onto a base plan. The three most important factors for most projects are sun path, wind patterns, and hydrology.
For sun path, plot the solar angles at the summer and winter solstices. This tells you which facades will receive the most heat gain and where shadows will fall. For wind, identify the prevailing direction and secondary patterns from local meteorological data. For hydrology, mark surface water flow directions based on topographic contours and note any flood risk zones from government mapping.
📌 Did You Know?
According to the American Institute of Architects (AIA), buildings oriented with their long axis running east-west can reduce cooling loads by up to 30% in temperate climates, simply because less wall area faces the harsh east and west sun angles.

Step 4: Analyze Circulation and Access
Map every way people and vehicles can reach the site. Mark primary roads, secondary streets, pedestrian paths, and public transport stops. Note traffic volumes if data is available, or estimate them from your site visit observations. Identify where the main vehicular entry should go based on road hierarchy and visibility splays.
Inside the site boundary, consider how users will move between parking, the building entrance, and any outdoor spaces. Circulation analysis often reveals conflicts early. For example, a loading dock on the same street as the main pedestrian entrance creates safety and aesthetic problems that are easier to solve on paper than after construction.
Step 5: Study the Social and Cultural Context
Good site analysis in architecture goes beyond physical measurements. Talk to neighbours if you can. Understand the demographics of the area, the history of the site, and any cultural significance it holds. A site that was once a public market may carry community expectations that influence your program. Census data, local news archives, and community plans are useful sources here.
⚠️ Common Mistake to Avoid
Many students treat site analysis as a box-ticking exercise and produce pages of data without connecting it to design decisions. Every piece of information you include should have a “so what” statement: “Prevailing wind is from the southwest, so the main living spaces should open toward this direction for natural ventilation.” Data without interpretation is just noise.

How to Create Site Analysis Architecture Diagrams
The final deliverable of your analysis is a set of clear, layered diagrams. Each diagram should communicate one main idea. Trying to show sun path, wind, traffic, and vegetation on a single sheet creates visual clutter that hides the information instead of revealing it.
Architecture Site Analysis Diagram Types
The table below summarizes the most common diagram types used in site analysis architecture presentations.
| Diagram Type | What It Shows | Typical Tools |
|---|---|---|
| Sun Path Diagram | Solar angles, shadow zones, seasonal variation | Ladybug (Grasshopper), SunCalc |
| Wind Rose | Prevailing wind direction, speed, and frequency | Meteorological data, Grasshopper |
| Circulation Map | Vehicular and pedestrian movement patterns | AutoCAD, Illustrator, hand sketch |
| Topography and Hydrology | Contour lines, slope, drainage direction | QGIS, Google Earth, Rhino |
| Noise and Sensory Map | Sound levels, visual buffers, smell sources | On-site measurement, Illustrator |
| Land Use and Zoning | Surrounding functions, zoning boundaries | Municipal GIS portals, QGIS |
For detailed guidance on presenting these diagrams effectively, read this guide on site analysis presentation techniques. If you are new to diagramming in general, this overview of architectural diagrams covers the fundamentals.
💡 Pro Tip
Use a consistent colour code across all your architectural site analysis diagrams. For example, green for vegetation, blue for water and drainage, red for vehicular routes, and orange for noise sources. When a reviewer flips through your presentation, the colour language builds recognition instantly and makes your analysis easier to follow.
Tools and Software for Architecture Site Analysis
You do not need expensive software to produce professional-quality analysis. QGIS is a free, open-source GIS platform that handles topographic data, land-use overlays, and demographic mapping. Google Earth provides aerial views and historical imagery so you can see how a site has changed over time. For producing final site analysis diagrams, students commonly combine CAD linework with Photoshop or Illustrator for graphic clarity.
AI-powered tools are also entering the workflow. Several platforms now offer automated ai site analysis architecture features that pull climate data, zoning information, and demographic statistics into a single dashboard. These tools speed up the data-gathering phase but should not replace on-site observation and critical thinking.
Video: Architecture Site Analysis for Beginners
This video walks through the full site analysis process from start to finish, covering the same core steps outlined above with visual examples from real student projects.
Where to Go From Here
Your Next Step: Pick a site near your campus or home and run through all seven steps this week. Give yourself two hours for desk research and one hour for the site visit. Produce one diagram per factor (sun, wind, circulation, land use) on a single A3 sheet with a shared base map. By the time your next studio brief arrives, the process will already feel familiar, and you can focus on design rather than figuring out how to read a site. For further reading, explore how site analysis feeds into concept diagram development.
Frequently Asked Questions
What are the main components of architectural site analysis?
The main components include topography, climate (sun path and wind), hydrology, circulation and access, vegetation, existing built context, zoning and legal constraints, noise and pollution sources, and socio-cultural factors. Each component produces its own layer of data that, combined, forms a complete picture of the site’s conditions.
How long does a site analysis take for a student project?
For a typical studio project, expect to spend 8 to 15 hours total. Roughly half of that goes to desk research and data collection, a quarter to on-site observation, and the remaining quarter to diagram production. More complex urban sites or competition entries may require significantly more time.

Which software is best for site analysis architecture diagrams?
QGIS is the strongest free option for mapping and spatial data. AutoCAD or Rhino handle precise site plans. Adobe Illustrator or Photoshop are widely used for final diagram graphics. Grasshopper with Ladybug plugins is popular for environmental data like sun path and wind analysis. Many students combine two or three of these tools depending on the diagram type.
How does site analysis differ in landscape architecture?
Site analysis in landscape architecture places greater emphasis on ecology, soil composition, plant communities, and water systems. While building-focused site analysis prioritizes structure placement and orientation, landscape analysis looks more closely at grading, stormwater management, habitat corridors, and seasonal planting cycles.
- ai site analysis architecture
- architectural site analysis
- architectural site analysis diagrams
- architectural site analysis guide
- architecture site analysis
- architecture site analysis diagrams
- architecture site analysis examples
- site analysis architecture
- site analysis architecture diagram
- site analysis in architecture
- site analysis landscape architecture


Leave a comment