


Table of Contents Show
Daylight analysis is the process of measuring and simulating how natural light enters and moves through a building across different times of day and seasons of the year. Architects use sun-path diagrams, shadow studies, and illuminance simulations to inform decisions about orientation, glazing, shading devices, and interior layout.
Getting daylight right affects everything from occupant comfort and energy bills to LEED and BREEAM certification scores. The challenge is that sunlight behavior changes constantly. A south-facing facade in New York at noon in December looks nothing like the same facade in June. To account for these variations, architects rely on daylight analysis software that can model the sun’s position at any latitude, date, and time, then project the resulting light and shadow onto a 3D building model or site plan.
This guide compares seven practical tools for daylight analysis in architecture, ranging from BIM-integrated plugins for Revit and Rhino to standalone web apps and mobile shadow trackers. Each tool fills a different role in the design workflow, so the right choice depends on your project stage, software stack, and the level of detail you need.
How Daylight Analysis Works in Architectural Design

Before comparing individual tools, it helps to understand what daylight analysis actually involves. The sun follows a predictable arc across the sky that shifts with latitude and season. A sun-path diagram plots this arc on a stereographic projection, showing solar altitude and azimuth for every hour of the year. From this diagram, architects can read when direct sunlight will strike a particular surface, when shadows from neighboring buildings will block it, and how long any given area stays in shade.
Shadow studies take this a step further by projecting sun geometry onto a 3D model of the building and its surroundings. The output is a visual map of shaded and sunlit areas at specific dates and times, typically the solstices and equinoxes. More advanced site analysis techniques combine shadow studies with illuminance calculations, where simulation engines like Radiance trace light rays through windows and off surfaces to predict the actual light levels (measured in lux) on a given work plane.
For certification purposes, metrics such as Daylight Autonomy (DA), Spatial Daylight Autonomy (sDA), and Annual Sunlight Exposure (ASE) quantify how well a space performs over a full year. These annual metrics require climate data (typically in EPW format) and validated simulation engines, which is why professional-grade tools tend to be more complex than simple sun-position calculators.
📐 Technical Note
LEED v4.1 requires a minimum sDA(300/50%) of 55% of regularly occupied floor area for 2 points, or 75% for 3 points, as defined in the IEQ credit for Daylight. ASE(1000/250) must not exceed 10% in any regularly occupied space. These thresholds are based on IES LM-83-12, which specifies annual climate-based daylight metrics using validated Radiance-based simulations.
Autodesk Insight: Revit Daylight Analysis Plugin
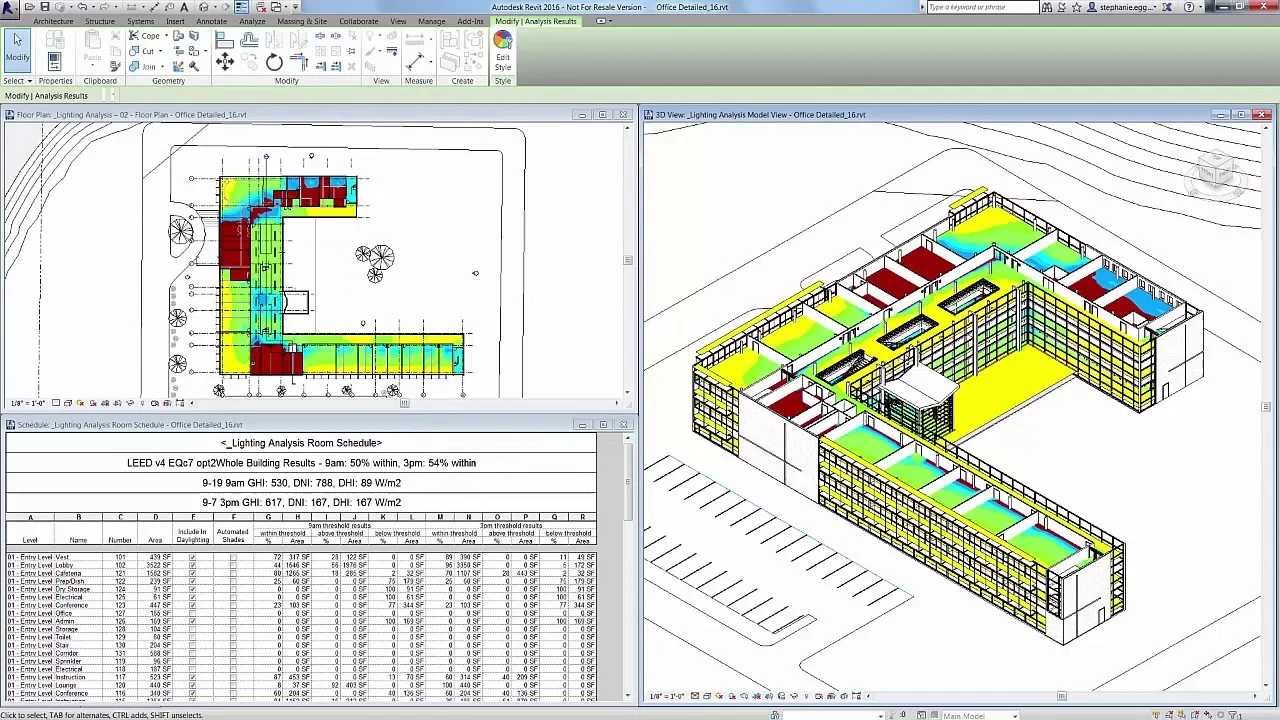
If your firm works in Revit, the most direct path to daylight analysis is Autodesk Insight. This plugin adds lighting, solar, and energy analysis capabilities directly inside the Revit environment. You can run illuminance studies, daylight factor calculations, and LEED-aligned sDA/ASE simulations without leaving your BIM model.
Insight processes simulations through Autodesk’s cloud rendering service, which means the heavy computation happens on remote servers rather than your local machine. Results are displayed back on your Revit model using the Analysis Visualization Framework (AVF), so you can see color-coded light level maps overlaid on floor plans and 3D views. The plugin supports seven analysis types as of recent versions, including custom illuminance studies where you set specific dates, times, and sky conditions.
The main limitation is setup overhead. You need properly enclosed rooms, correctly assigned material reflectance values, and accurate glazing transmittance (TVis) properties for every window family. If any of these are missing or incorrect, the results will be unreliable. The minimum analysis grid resolution is 12 inches (30 cm), which may be too coarse for detailed glare studies near windows.
💡 Pro Tip
Before running a Revit daylighting analysis with Insight, purge all unused materials from your model first, then verify the RGB reflectance values of every remaining opaque material. The plugin only reads the custom RGB color value from the Appearance tab, and ignores all other reflectivity properties. Skipping this step is the most common reason for inaccurate illuminance results.
Ladybug Tools: Open-Source Daylight Analysis for Rhino and Grasshopper
Ladybug Tools is a free, open-source suite of plugins for Grasshopper (the visual scripting environment inside Rhino). The suite includes Ladybug for climate analysis and sun-path visualization, and Honeybee for detailed daylight and energy simulations powered by Radiance and EnergyPlus. With over 500,000 downloads, it has become one of the most widely used environmental analysis platforms in architecture.
The Ladybug component generates interactive 3D sun-path diagrams directly in your Rhino viewport. You import a local EPW weather file, set your analysis period, and the plugin draws the sun’s trajectory with hour markers and radiation data. From there, you can run shadow range studies, sunlight hour analyses, and radiation maps on any surface in your model. The Honeybee component handles the heavier work: point-in-time illuminance, annual daylight metrics (DA, cDA, UDI, ASE), and image-based glare studies using Daylight Glare Probability (DGP).
The learning curve is steeper than a button-click plugin. You build analysis workflows by connecting Grasshopper components on a canvas, which requires comfort with visual programming. But this same parametric structure is also the tool’s biggest strength: you can run hundreds of design variations automatically and compare their daylight performance side by side. For firms doing parametric work in Rhino, Ladybug Tools fits naturally into existing workflows.
🎓 Expert Insight
“Ladybug and Honeybee have given us the tools we need as designers to gain an understanding of the environmental consequences of our design decisions from the comfort of our preferred design platform.” — Senior Computational Designer, Grimshaw Architects
This reflects a broader industry shift: daylight analysis is moving from specialist consultants into the hands of design teams, largely because tools like Ladybug make simulation accessible within the same software used for modeling.
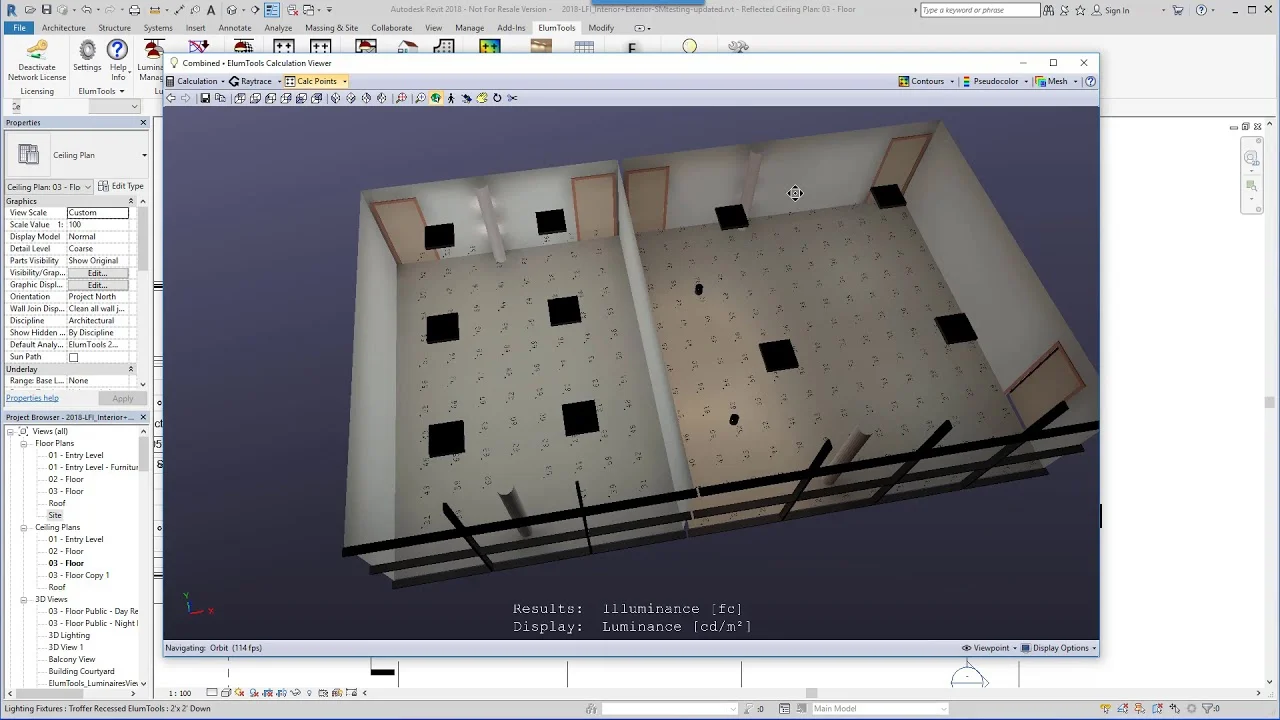
ElumTools: Professional Lighting Calculation Inside Revit
ElumTools by Lighting Analysts is a commercial Revit plugin focused specifically on lighting calculation. Unlike Insight, which covers energy and solar analysis alongside daylighting, ElumTools concentrates on accurate illuminance and luminance prediction using an advanced radiosity engine. It reads Revit room definitions and lighting fixture families (including IES photometric files) to calculate light distribution across interior spaces.
What sets ElumTools apart for revit daylight analysis is its ability to combine electric lighting and daylight in a single simulation. You can model how artificial fixtures supplement natural light at different times of day, which is critical for offices, schools, and healthcare facilities where consistent light levels matter. The plugin also includes a Layout Assistant that suggests fixture placement based on target illuminance values, then exports those positions directly into your Revit model.
ElumTools produces pseudocolor analysis views, isolines, and detailed reports that can be shared with clients and code reviewers. For firms that need to validate lighting code compliance (IES standards, ASHRAE 90.1 lighting power density) within their BIM workflow, this is one of the most capable options available.
Sun Diagram: SketchUp Extension for Shadow Studies
For architects working in SketchUp, Sun Diagram is a dedicated extension that generates 3D sun-path diagrams and animated shadow studies directly inside your model. You enter your project coordinates (or pull them from SketchUp’s geo-location feature), and the plugin draws the sun’s arc for any date. A real-time slider lets you scrub through hours and months to see how shadows shift across your site.
The extension exports shadow sequence images at up to 4K resolution, including vertical 9:16 formats sized for Instagram Reels and TikTok. This makes it particularly useful for presentation: you can compile exported frames into a time-lapse video showing shadow movement across an entire day. The paid versions add Daylight Saving Time support, custom date selection, and head-up display overlays showing solar data in the viewport.
Sun Diagram is not a simulation engine. It calculates sun position and casts geometric shadows, but it does not compute illuminance values or annual daylight metrics. For concept-stage solar orientation studies and client presentations, though, it delivers fast, visually clear results without the setup complexity of Radiance-based tools. If you want to pair it with a rendering workflow, check our comparison of architecture software options.
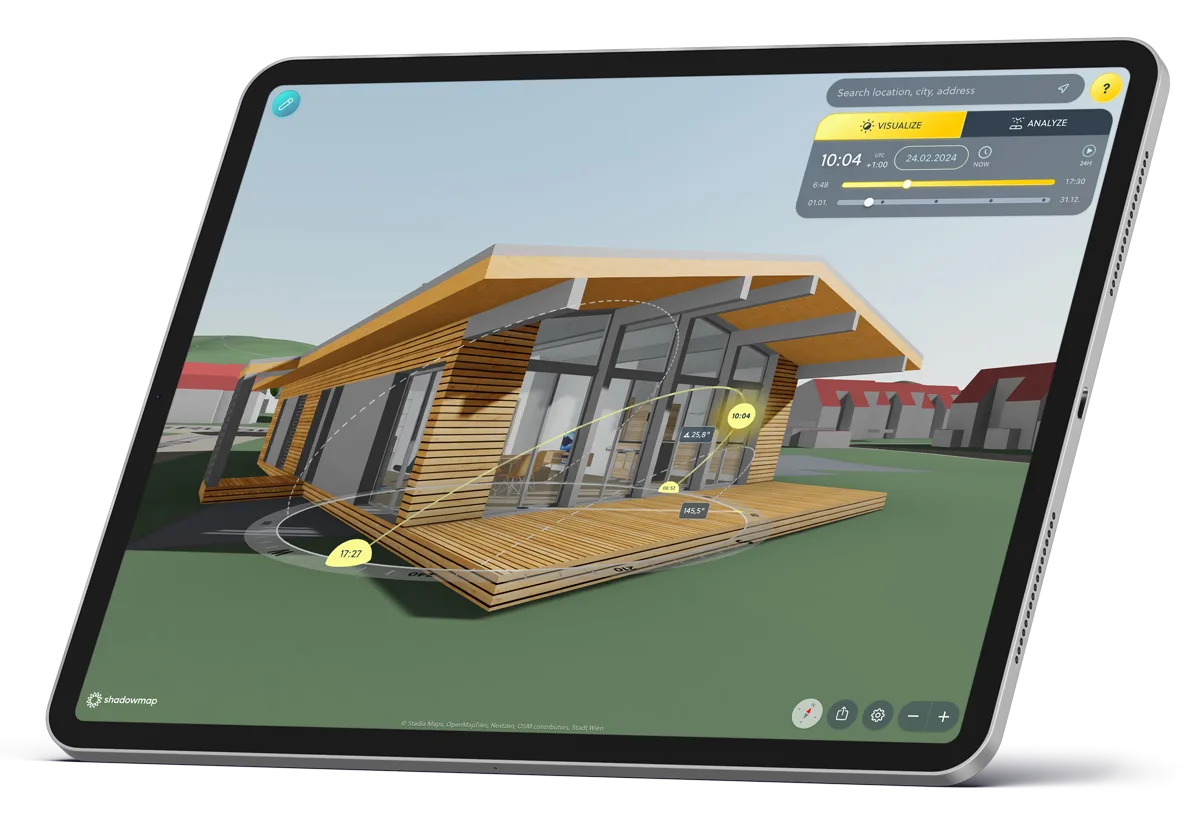
Shadowmap: Browser-Based 3D Shadow Simulation
Shadowmap takes a different approach from BIM plugins. It is a web-based application that overlays real-time sun and shadow simulations onto a global 3D map. You type in any address, and the app shows you shadow patterns cast by existing buildings and terrain at any date and time. The free tier gives you basic 3D navigation and shadow visualization; paid plans add the ability to upload custom 3D models, edit existing buildings, and export solar analytics as CSV files.
Shadowmap Studio, the version aimed at architects, lets you import your own building geometry into the 3D city context and run irradiance analysis on facades and rooftops. This is especially valuable for urban infill projects where neighboring structures create complex shading conditions that are hard to estimate from floor plans alone. You can also generate shareable, interactive 3D previews for stakeholders, which clients can view on any device without installing software.
The tool won the APTI Award in 2024 and continues to expand its high-resolution digital twin coverage. For early-stage site analysis, especially for checking how much sunlight a plot receives before you even start modeling, Shadowmap removes a significant amount of guesswork.
⚠️ Common Mistake to Avoid
Many architects run shadow studies using only the summer and winter solstices, then assume performance is acceptable year-round. Equinox conditions (March and September) often reveal the worst glare problems because the sun sits at a mid-altitude angle that passes below horizontal shading devices designed for summer. Always include at least four dates in your shadow study: both solstices and both equinoxes.
What Is the Best Daylight Analysis Software for Mobile?
Field visits often require quick sun-position checks before returning to the office, and two mobile apps stand out for this purpose.
Sunlitt (iOS) combines a sun-path compass, augmented reality sun overlays, and a city-level shadow map into a single app. The AR mode lets you point your phone camera at a window opening and see exactly where the sun will be at any future date and time. The shadow map feature visualizes how surrounding buildings cast shadows hour by hour, which is useful for checking claims about sunlight exposure when evaluating a property or site. Over 200,000 users worldwide rely on it for photography planning, real estate, and architectural site visits.
SunOnTrack (formerly Sunnytrack, available on iOS and Android) offers similar sun-position tracking with AR visualization, golden hour timing, and shadow projection on maps. Its strength is cross-platform availability and a clean interface that focuses on sun-path geometry without overwhelming you with data panels.
Neither app replaces a full daylight analysis software workflow, but both save time during the earliest project stages when you need to understand a site’s solar exposure before any 3D modeling begins.
How to Run Daylight Analysis in Revit
Because Revit is the most widely used BIM platform in architecture, daylight analysis in Revit deserves a closer look at the actual workflow. You have two primary paths: the built-in Insight plugin for cloud-based illuminance and sDA studies, or a third-party tool like ElumTools for local radiosity calculations.
For the Insight route, start by setting your project location accurately under Manage > Project Location. Ensure your model uses building elements (not masses), and that all rooms are properly enclosed with defined floor areas. Next, assign realistic material reflectance values: interior walls typically sit around 50% reflectance, ceilings around 70 to 80%, and floors around 20 to 30%. For glazing, set the visible transmittance (TVis) through the custom RGB color value in the Appearance tab of each glass material.
From the Analyze tab, select Lighting from the Insight panel and choose your analysis type. For LEED documentation, the sDA and ASE presets auto-populate the correct date ranges, sky conditions, and grid specifications. For custom studies, you can set any date, time, and sky model (the Perez sky model is the industry standard for daylighting simulations). Hit Start Analysis, and Insight processes the simulation on Autodesk’s cloud servers. Results typically return within minutes for small models, or up to an hour for complex multi-story buildings.
If you prefer to keep everything local and need combined electric and daylight calculations, ElumTools handles the computation on your own machine using IES-standard radiosity. The workflow is similar: define rooms, assign materials, place fixtures, and run the calculation. Results display as color-coded analysis views in your Revit model, with the ability to export detailed reports.
💡 Pro Tip
When reviewing Insight daylighting results in Revit, generate the analysis in a 3D view, then cut a section through the building to see the color-coded illuminance map in the context of the actual floor plan. Use the Analysis Results Settings to toggle visibility off for floor levels that obscure the level you are studying. This gives you a much clearer reading than the default overhead view.
Comparison of Daylight Analysis Tools for Architects
The following table summarizes how each tool fits into different stages of the design process.
| Tool | Platform | Best For | Annual Metrics | Price |
|---|---|---|---|---|
| Autodesk Insight | Revit (plugin) | LEED compliance, BIM workflow | Yes (sDA, ASE, DF) | Included with Revit subscription |
| Ladybug Tools | Rhino + Grasshopper | Parametric studies, research | Yes (DA, cDA, UDI, ASE, DGP) | Free, open-source |
| ElumTools | Revit (plugin) | Combined electric + daylight calc | Point-in-time illuminance | Commercial license |
| Sun Diagram | SketchUp (extension) | Shadow animation, presentations | No | Free / Studio / Pro tiers |
| Shadowmap | Web browser | Urban context shadow analysis | Solar irradiance (Studio plan) | Free / Explorer / Home / Studio |
| Sunlitt | iOS | AR site visits, sun-path scouting | No | Free / Premium |
| SunOnTrack | iOS, Android | Cross-platform sun tracking | No | Free / Pro |
Video: Shadow Analysis and Solar Study in Revit
This tutorial walks through enabling shadows, setting up sun-path diagrams, and performing solar studies in Revit using built-in tools. It covers location setup, shadow customization, and creating presentation-ready solar animations.
How to Choose the Right Daylight Analysis Tool
Your choice of daylight analysis software depends on three factors: project stage, platform, and the level of accuracy required.
During early concept design, you need fast feedback, not decimal-point precision. Shadow studies in SketchUp (using Sun Diagram or the built-in Shadows panel) or browser-based tools like Shadowmap and SunCalc give you a quick read on solar orientation and neighboring shadow conditions within minutes. Mobile apps like Sunlitt and SunOnTrack serve the same purpose during site visits. These tools answer the question: “Does this site get enough sun for what I’m designing?”
During design development, when the BIM model has walls, windows, and rooms defined, daylight analysis in Revit through Insight or ElumTools makes the most sense. These tools read directly from your model geometry, so there is no file export or translation step. If you are working toward LEED or BREEAM certification, Insight’s built-in presets for sDA and ASE simplify documentation. For firms using Rhino, Ladybug Tools offers the same level of rigor with added parametric flexibility.
For specialized research, academic work, or projects that require full annual climate-based simulations with custom sky models, Ladybug Tools (Honeybee) is the most capable free option. Its integration with Radiance, the Perez sky model, and EnergyPlus gives it simulation accuracy comparable to commercial alternatives. The trade-off is a steeper learning curve, as you need to be comfortable building Grasshopper definitions.
🏗️ Real-World Example
The Edge (Amsterdam, 2014): Designed by PLP Architecture for Deloitte, this office building used extensive daylight analysis during design to achieve a BREEAM Outstanding score of 98.36%, the highest ever recorded at the time. Approximately 28,000 sensors throughout the building continuously monitor daylight levels and adjust LED lighting accordingly, reducing lighting energy consumption by roughly 65% compared to a conventional office. The project demonstrated how integrating daylight analysis software early in design can directly translate into measurable performance outcomes.
Final Thoughts
Daylight analysis has moved from a specialist consulting task to an integrated part of the design workflow. Whether you are checking sun angles on your phone during a site visit, running a quick shadow study in SketchUp, or performing a full annual sDA simulation in Revit, the tools exist to match every budget and skill level. The key is using the right tool at the right project stage, starting simple and adding precision as the design develops.
For architects building their understanding of light in architecture, these tools turn abstract solar geometry into concrete, data-driven design decisions. Pair them with a solid site analysis presentation, and you have a strong foundation for designs that perform well in both daylight and energy terms.
✅ Key Takeaways
- Daylight analysis architecture workflows should match tool complexity to project stage: mobile apps and web tools for site scouting, BIM plugins for design development, and Radiance-based tools for certification.
- Revit daylight analysis through Insight requires accurate material reflectance values and properly enclosed rooms for reliable results.
- Ladybug Tools offers the most capable free option for parametric daylight studies, annual metrics, and glare analysis in Rhino/Grasshopper.
- Shadow studies should always include at least four dates (both solstices and both equinoxes) to catch mid-altitude glare conditions that summer-only studies miss.
- Browser-based tools like Shadowmap let architects assess urban shadow conditions before modeling begins, saving hours of guesswork on infill projects.


Leave a comment