



Table of Contents Show
GIS data for urban design gives planners a single spatial framework to map terrain, land use, zoning, and population patterns before a single line is drawn. By layering these datasets in a geographic information system, urban designers test ideas against real site conditions and base site planning decisions on measurable evidence rather than assumption.
The link between Urban Design and Site Planning has always depended on accurate information about a place. What has changed is how that information is collected and read. A geographic information system stores spatial layers that can be combined, queried, and measured, which turns a flat survey into a working model of the site. This guide walks through where the data comes from, how to build base layers, how to run the core analysis, and how to pull usable urban design metrics from gis data that a planning team can act on.

What Is GIS Data and Why It Shapes Urban Design
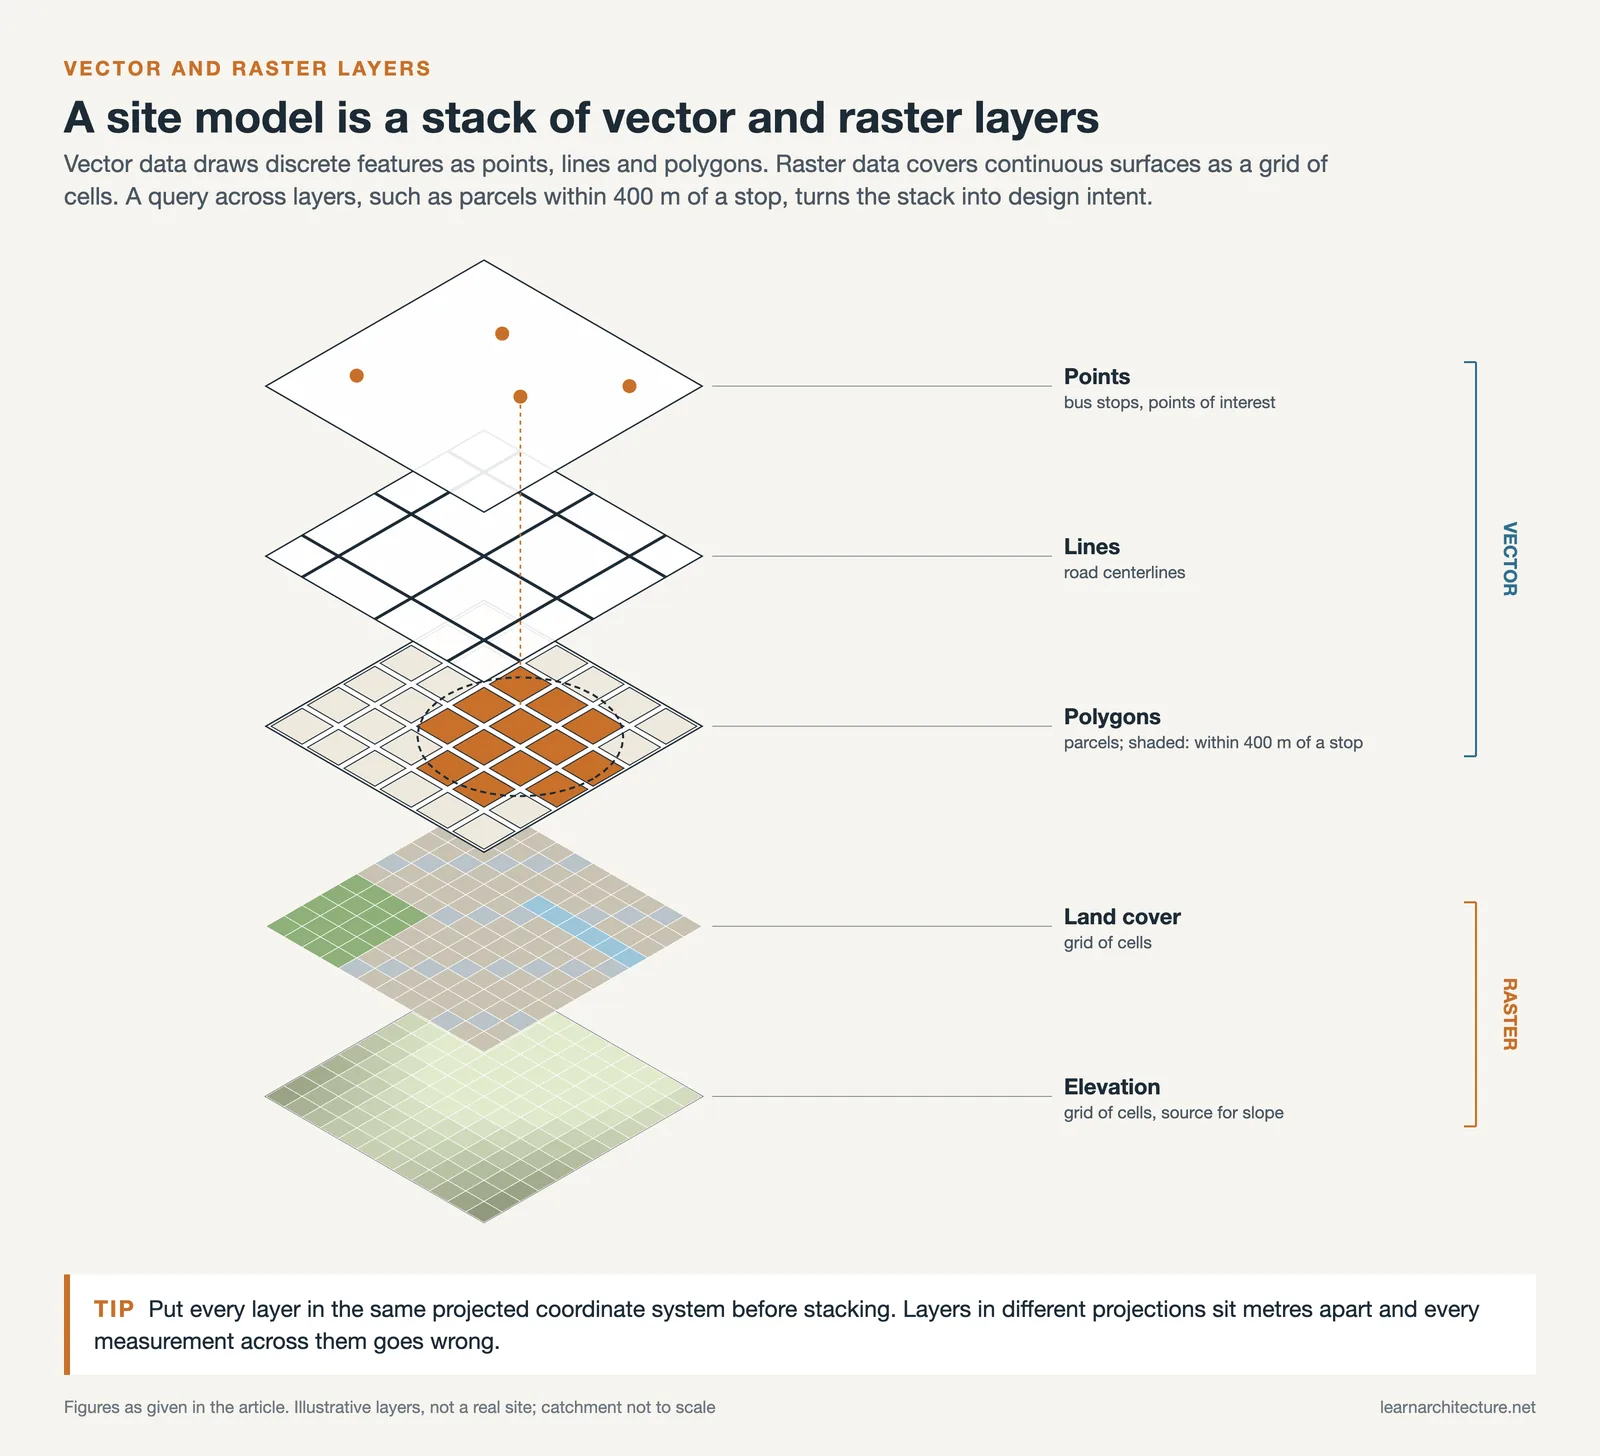
A GIS stores two broad data types. Vector data describes discrete features as points, lines, and polygons: a bus stop, a road centerline, a parcel boundary. Raster data describes continuous surfaces as a grid of cells, such as elevation, temperature, or land cover. Most urban design and gis work mixes both, layering parcels and street networks over a terrain surface and an aerial image.
The reason gis urban design has spread so quickly is that spatial layers can be measured and recombined. You can ask a parcel layer how many lots fall within 400 meters of a transit stop, then shade those parcels to show walkable catchment. That kind of query connects raw geography to design intent, which is exactly the bridge that older paper maps could not provide. The same logic supports related work in architectural map making, where layered data carries the analysis.
📌 Did You Know?
The first true geographic information system was the Canada Geographic Information System, built in the 1960s by Roger Tomlinson for the Canada Land Inventory. It was created to measure land capability across millions of acres, a task that paper maps could not handle at national scale.

Why GIS Data for Urban Design Matters in Site Planning
Site planning fails when a design assumes conditions that the ground does not support. A scheme placed on a 12 percent slope, or across a floodplain, or away from existing service lines, carries cost and risk that surface as soon as engineering review begins. GIS data for urban design front-loads those checks. Before the massing study, you already know the slope, the drainage paths, the soil class, and the regulatory limits that apply to each part of the parcel.
This also keeps the social and environmental layers in view from the start. Population density, age distribution, income bands, and access to green space all sit in public datasets that can be mapped against the site. Reading them early supports the kind of balanced outcome that strong landscape architecture and urban design aims for, where built form responds to both people and place.
How to Use GIS Data for Urban Design Step by Step
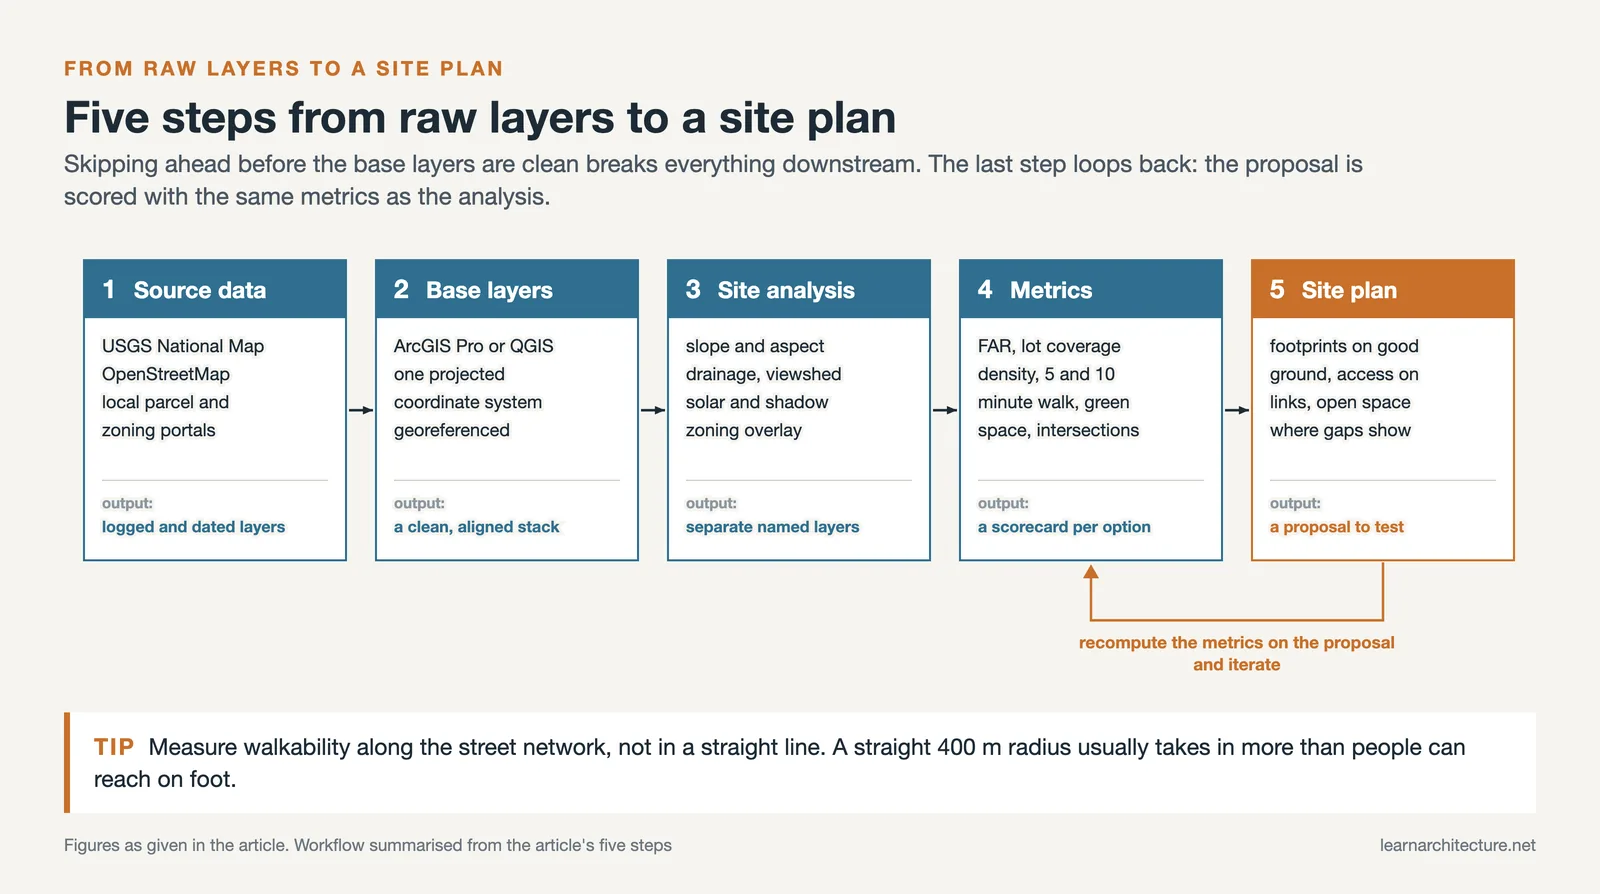
The workflow below moves from raw data to a defensible site plan. Each step produces an output the next step depends on, so resist the urge to skip ahead before the base layers are clean.
Step 1: Source and Gather Spatial Data
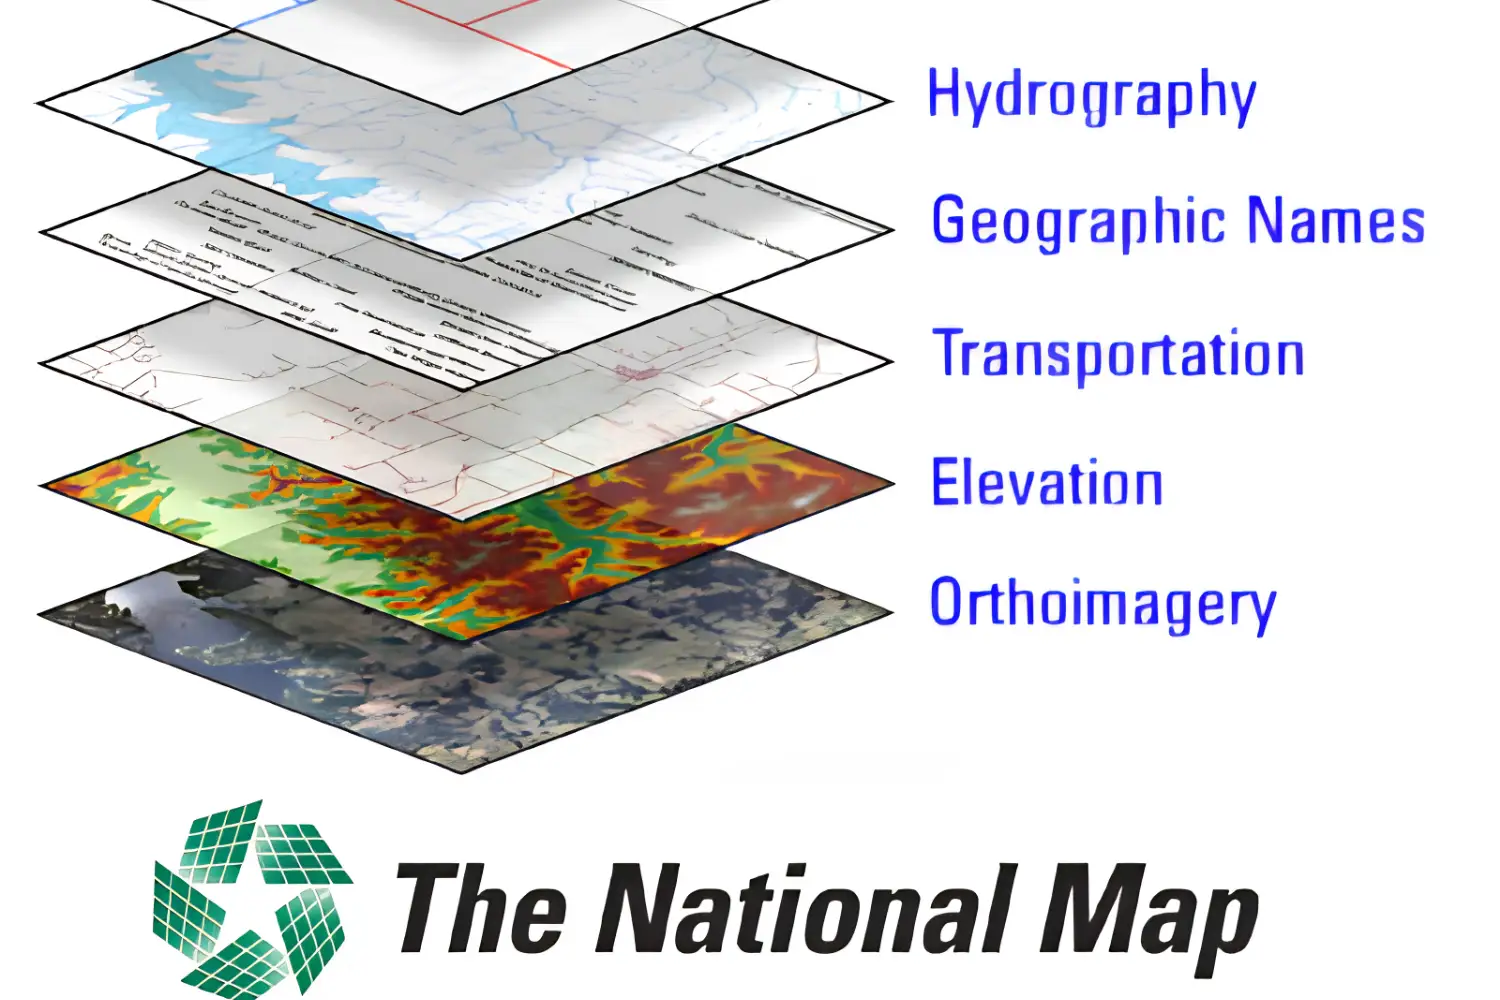
Start with authoritative open data. In the United States, the USGS National Map supplies elevation, hydrography, land cover, and transportation layers at no cost. For street networks, building footprints, and points of interest in nearly any region, OpenStreetMap offers community-maintained vector data you can download and clip to your study area. Local government portals usually hold the parcel boundaries, zoning districts, and utility lines that matter most for a specific site.
Record the source, date, and accuracy of every layer you collect. A demographic layer from a 2020 census behaves very differently from a 2026 estimate, and mixing the two without noting it is how analysis quietly goes wrong.
Step 2: Build Base Layers in a GIS Platform
Two platforms cover most urban design work. Esri ArcGIS Pro is the industry standard desktop GIS, with deep analysis tools and strong support for shared web maps. QGIS is free and open source, reads the same file formats, and runs the core analysis a planning team needs without a license cost. Either one will import your layers, set a common map projection, and stack them into a single project.
The first technical task is georeferencing: making sure every layer lines up in the same coordinate space. A parcel map in one projection and a terrain model in another will appear offset by meters or more, and any measurement taken across them will be wrong.
💡 Pro Tip
Set your project to a local projected coordinate system before you add a single analysis layer, not a global geographic one. Distances and areas measured in a projected system match the ground in meters or feet, while a raw latitude and longitude system distorts both, especially away from the equator.

Step 3: Run the Core Site Analysis
With clean base layers, the analysis begins. Derive a slope and aspect surface from the elevation model to find buildable ground and to flag steep zones. Trace drainage and flow accumulation to see where water collects, which protects you from siting habitable space in a wash. Run a viewshed to test sightlines, and a solar or shadow study to read light across the year. Overlay the zoning layer to confirm height, setback, and use limits per parcel.
Run these as separate, named layers rather than one merged map. Keeping slope, drainage, solar, and zoning apart lets you turn each on or off while reviewing a design, and it makes the reasoning behind a decision easy to show a client or a planning board. A combined image looks tidy but hides which factor drove a given move, and that traceability is part of what makes the gis and urban design approach defensible during review.
This is the spatial backbone of any serious site analysis, and GIS lets you produce it as measured layers rather than sketches. For a fuller checklist of methods to pair with the digital work, the breakdown of site analysis techniques covers field and survey steps that ground the data.
📐 Technical Note
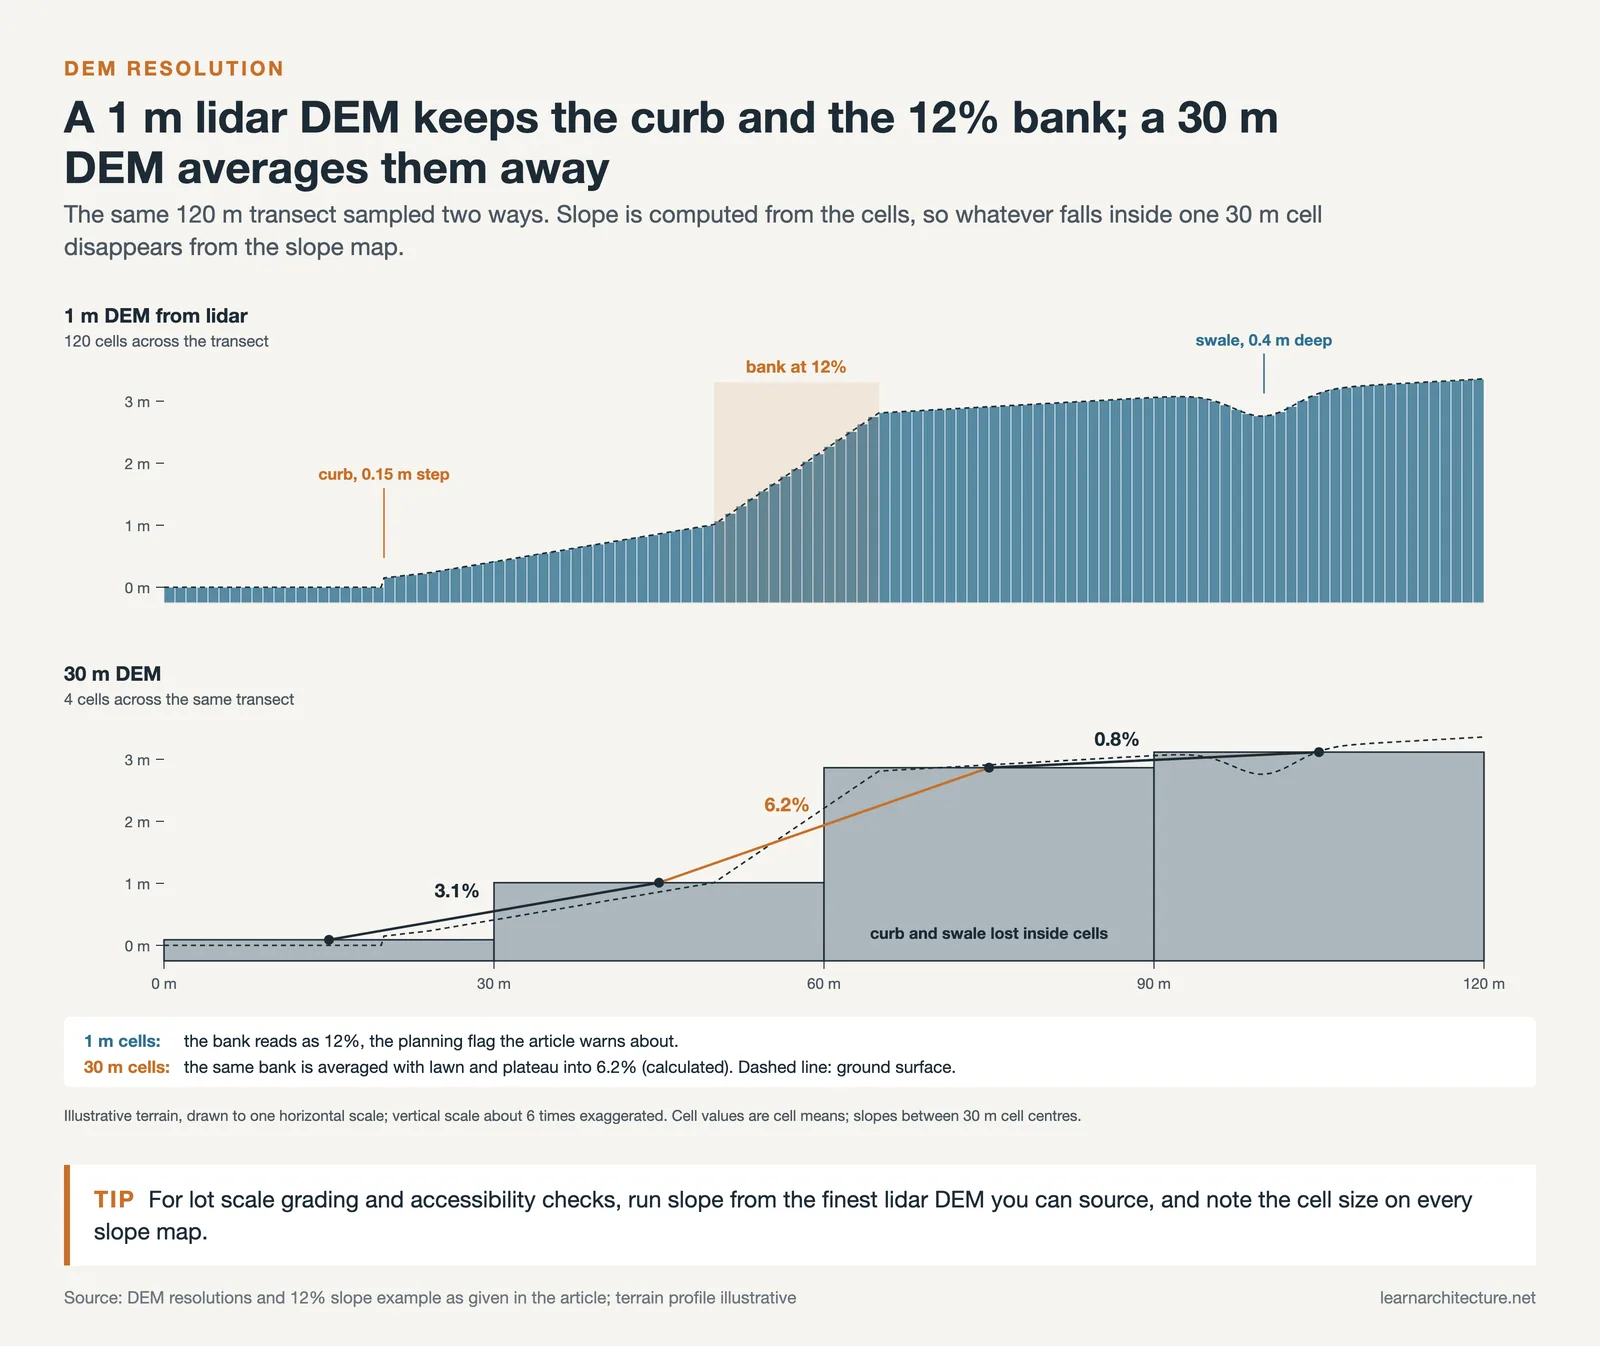
Slope analysis quality depends on the resolution of the input digital elevation model. A 1 meter DEM derived from lidar resolves small grading changes and curb lines, while a 30 meter DEM only shows broad landform. For lot scale grading and accessibility checks, source the finest DEM available for the site, since coarse data will smooth over the differences that drive design.
Step 4: Derive Urban Design Metrics From GIS Data
Analysis layers become design tools when they are reduced to numbers a team can compare. Pulling clear urban design metrics from gis data turns the map into a scorecard for testing options. Common metrics include:
- Floor area ratio and lot coverage, calculated per parcel from footprint and boundary polygons against zoning limits.
- Population and dwelling density within a defined catchment, joined from census layers.
- Walkability as the share of homes within a 5 minute or 10 minute walk of transit, schools, or parks, measured along the street network rather than in a straight line.
- Green space access, expressed as area of accessible open space per resident.
- Intersection density and block size, which read how connected and walkable a street grid is.
Because these values come from the same georeferenced layers, you can recompute them for each design variant and compare options on equal terms. Mapping land use against these numbers also feeds directly into zoning diagrams that communicate the plan to reviewers.
Step 5: Translate Findings Into a Site Plan
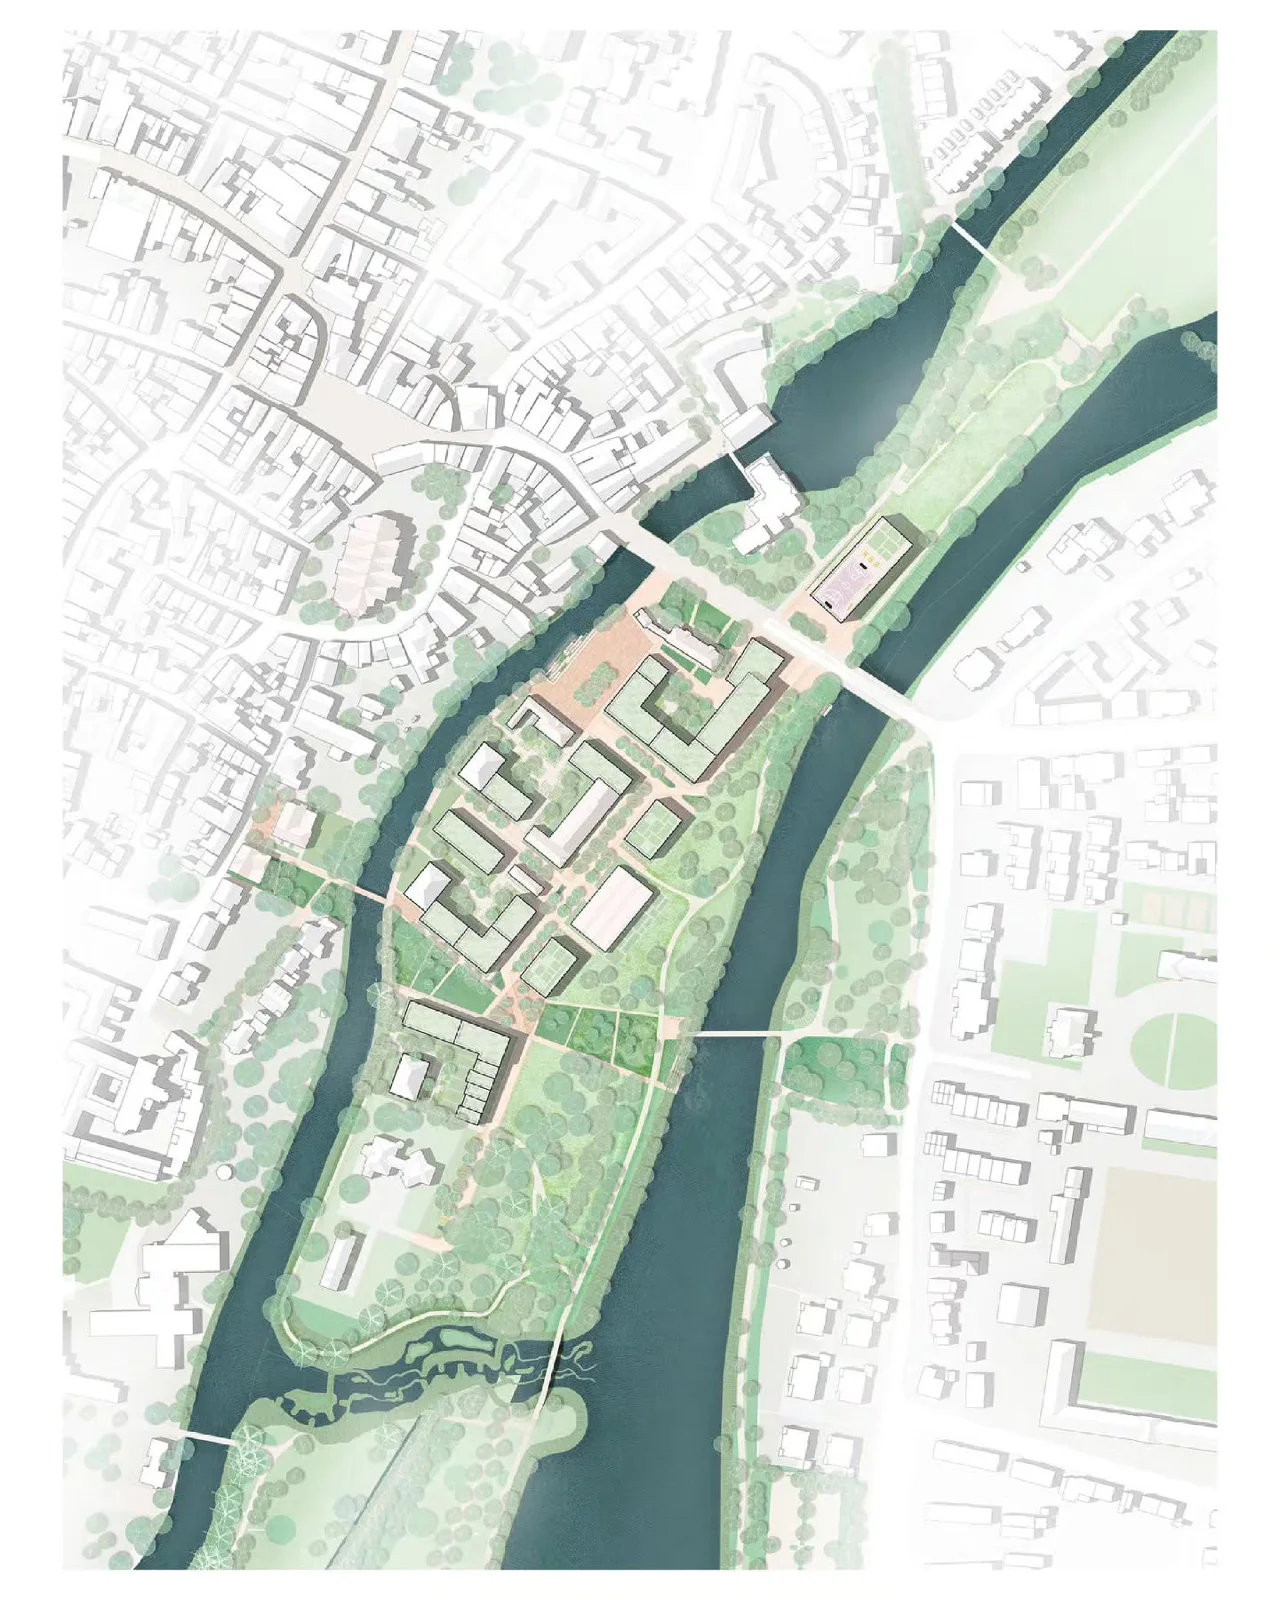
The last step moves from analysis back to design. Place buildable footprints on the gentle, well-drained, code-compliant ground the analysis identified. Route access along existing connections. Position open space where the catchment analysis shows a gap. Then recompute the metrics from Step 4 on the proposed layout to confirm the design performs as intended, and iterate where it does not.
⚠️ Common Mistake to Avoid
Treating GIS output as final truth is a frequent error. Open datasets carry positional error, outdated edits, and gaps, so a parcel line or contour can be off by meters. Always verify the layers that drive critical decisions against a current survey or a site visit before committing the design to them.
Best GIS Tools for Urban Designers
GIS for urban designers is not limited to one program. The table below sorts the common options by what they do best, so you can match a tool to the task rather than force one platform to cover everything.
GIS and Mapping Tools Compared
| Tool | Type | Best For | Access |
|---|---|---|---|
| ArcGIS Pro | Desktop GIS | Deep analysis, shared web maps | Paid license |
| QGIS | Desktop GIS | Full analysis on a budget | Free, open source |
| Autodesk Forma | Cloud design | Early massing and site testing | Paid subscription |
| OpenStreetMap | Open data source | Streets, footprints, points of interest | Free, open data |
For a wider look at platforms that pair with these, including real-time and 3D options, the roundup of urban mapping tools compares several systems side by side.
Building GIS Skills for Urban Planning and Design
Most architects meet GIS through practice rather than a single course, but structured learning shortens the climb. A focused GIS class on urban planning and design teaches projections, spatial joins, and analysis routines in the order you actually use them, which is faster than piecing it together from scattered tutorials. University extension programs, the documentation and training that ship with ArcGIS and QGIS, and open courseware all cover the core skills. Pick one real site, run the five steps above on it end to end, and the workflow sticks far better than any demonstration dataset.
Technical specifications and analysis outputs should be verified by a licensed professional for your specific project, since data accuracy and local regulations vary by site.

What This Means for Your Next Project
Your Next Step: Download the elevation and parcel layers for your current site from the USGS National Map and your local open data portal, load them into QGIS, and run a single slope and zoning overlay before your next design review. That one analysis will tell you more about what the site can hold than a week of assumptions.
Frequently Asked Questions
What GIS data do I need for urban design?
At minimum, gather an elevation model, parcel boundaries, zoning districts, a street network, and hydrography. Add demographic layers from the census and land cover for context. Source each from an authoritative provider such as a national mapping agency or a local government portal, and check the date so older and newer datasets are not mixed without care.
Is QGIS good enough for professional site planning?
Yes. QGIS reads the same file formats as commercial software and runs slope, drainage, viewshed, and network analysis that site planning needs. Many firms and public agencies use it for production work. The main tradeoff is fewer prebuilt tools and less vendor support than ArcGIS Pro, which larger teams may prefer for shared web services and enterprise data.
How does GIS improve site planning decisions?
GIS turns scattered information into measured layers you can query and overlay. Instead of guessing where slope, flooding, or zoning limits fall, you map them precisely and place the design on ground that supports it. Because the layers are numeric, you can recompute density, walkability, and coverage for each option and compare them on equal terms.
Can I use free data for GIS urban design work?
Open sources cover most needs. The USGS National Map, OpenStreetMap, and local government portals supply elevation, streets, footprints, parcels, and zoning at no cost. Free data still carries positional error and gaps, so verify any layer that drives a critical decision against a current survey or a site visit before relying on it.















Leave a comment