


Table of Contents Show
Site analysis tools are the software architects use to gather and read a site before design begins: mapping and GIS platforms, terrain and satellite sources, sun and climate calculators, and the regulatory data layers that come with them. Most projects need three or four of them rather than one, and several of the useful ones cost nothing.
This guide covers what the tools actually do, which are worth installing, and where the free options stop being enough. For the underlying method rather than the software, see the guide to architectural site analysis techniques.
Free Browser Tools You Can Use Right Now
The tools further down this page are the ones you install and learn. These are the ones you open in a tab and get an answer from in a minute, which is what most site analysis actually needs at the start of a project. None of them require an account.
- SunCalc: drop a pin and read the sun path, solar altitude and shadow direction for any date. The fastest way to check whether a courtyard gets winter sun.
- ShadeMap: real time shadows cast by terrain and existing buildings, animated through the day. This is the one SunCalc cannot do, because it uses actual building heights.
- Ventusky: wind direction and speed, temperature, rainfall and cloud cover on one animated map. Use it to find the prevailing wind before you commit to an opening strategy.
- Cadmapper: building footprints, roads and contours exported as CAD or SketchUp geometry. Up to one square kilometre is free, which covers most urban sites.
- Printmaps: an editor that pulls OpenStreetMap data into layers you can filter and restyle, then exports a high resolution PNG or a layered SVG. This is the shortcut to a presentable site plan.
- Contour Map Creator: select a rectangle on a map and get contour lines at the interval you choose. Enough for a topographic base when the site is not steep enough to justify a survey.
- Streetmix: draw the street section next to your site, with lane widths, pavements, planting and parking to scale. Useful when the argument is about the public realm rather than the plot.
For the sun specifically we built our own: the free sun path diagram generator draws the solar path for any latitude and exports SVG, PNG or CSV, with no signup.
A reasonable first hour on a new site is Cadmapper for the geometry, Contour Map Creator for the ground, SunCalc or ShadeMap for the light, and Ventusky for the wind. That gives you the four layers most concept decisions rest on, before any software is installed.
What Should A Site Analysis Tool Do?

A useful tool answers at least one of four questions, and the strongest ones answer several at once.
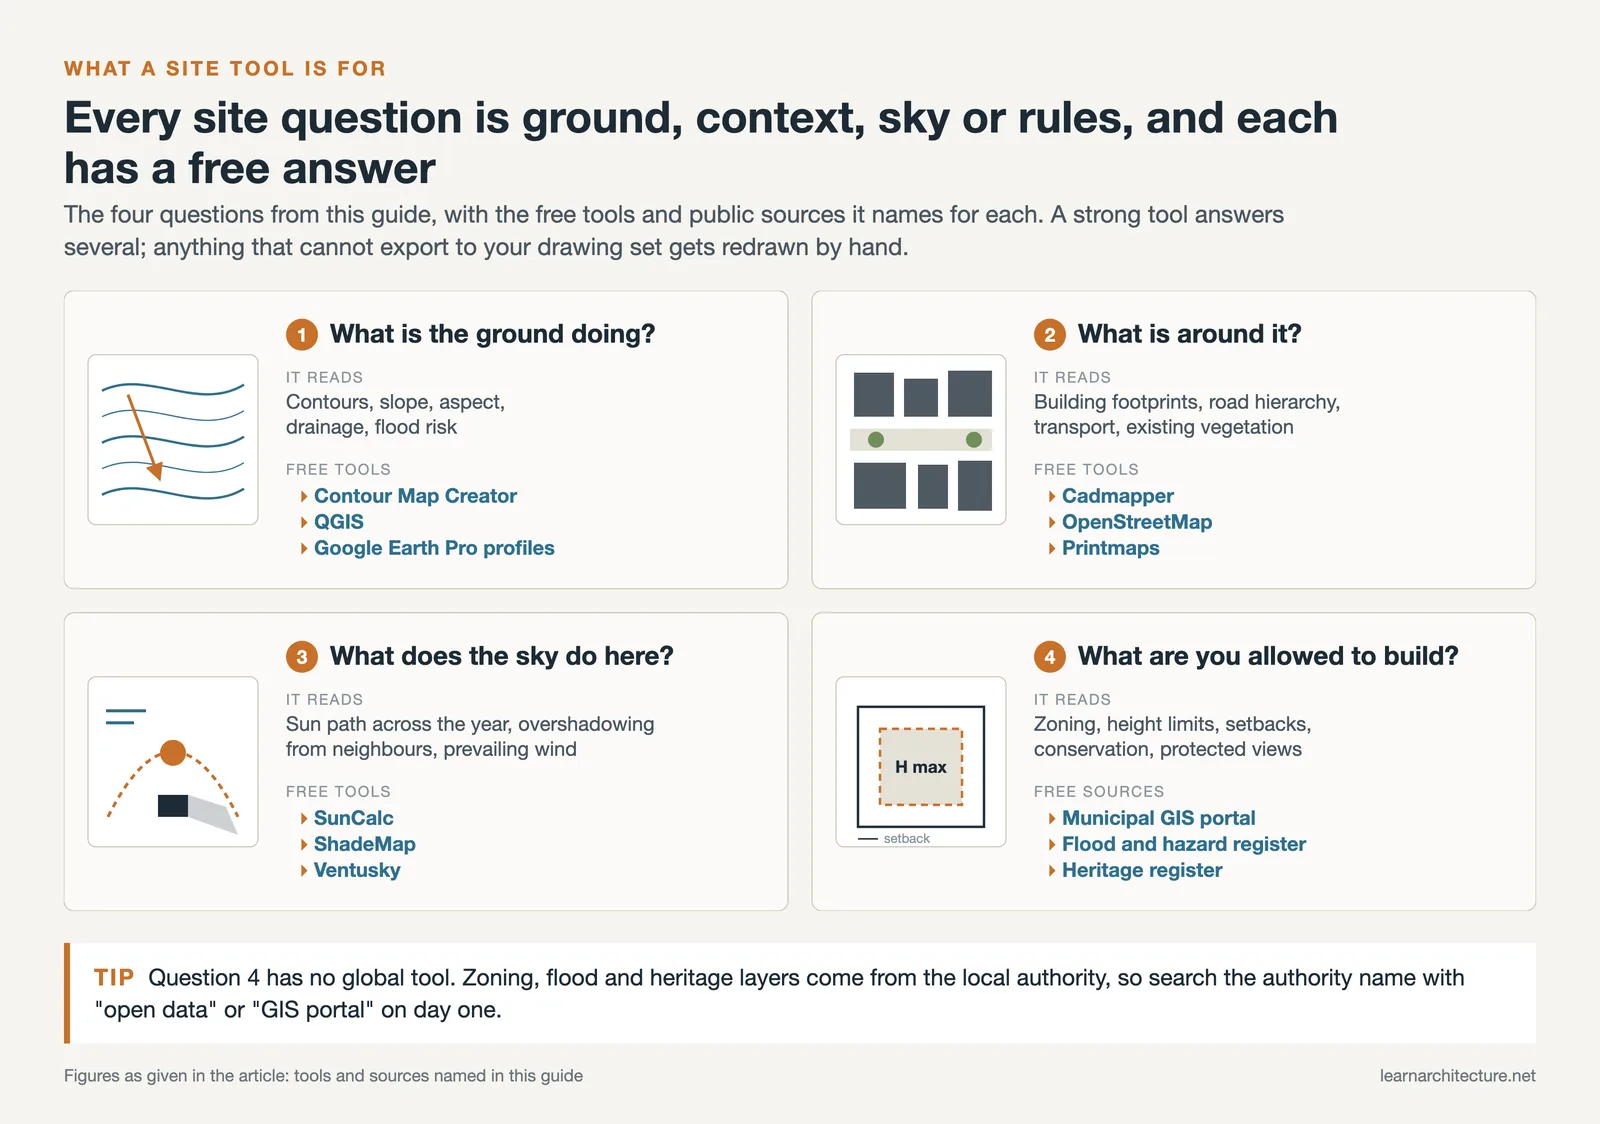
- What is the ground doing? Contours, slope, aspect, drainage and flood risk.
- What is around it? Building footprints, road hierarchy, transport, existing vegetation.
- What does the sky do here? Sun path across the year, overshadowing from neighbours, prevailing wind.
- What are you allowed to build? Zoning, height limits, setbacks, conservation and protected views.
Anything that cannot export into your drawing environment will end up being redrawn by hand, so file output matters as much as the analysis itself.
Free Site Analysis Tools Worth Installing
QGIS
QGIS is the open-source GIS platform most architects settle on. It reads almost every public dataset, handles contours, flood maps and land use as separate layers, and exports to formats that CAD accepts. The learning curve is real, but it replaces several paid tools once you are past it.
Google Earth Pro
Google Earth Pro is free and does three things quickly: historical imagery going back years, rough elevation profiles along a drawn line, and a sun shadow slider for a first read of overshadowing. It is not survey-accurate, and it should not be treated as though it were.
OpenStreetMap
OpenStreetMap supplies building footprints, road classifications and land use as editable vector data, which is exactly what a context plan needs. Coverage quality varies by city, so check the area before relying on it.
Cadmapper
Cadmapper converts open data into ready CAD and 3D files for a chosen area, which saves hours of tracing at concept stage. Smaller areas are free, and the output is a starting point rather than a survey.
⚠️ Common Mistake To Avoid
Treating open data as survey data. Google Earth elevations, OpenStreetMap footprints and Cadmapper exports are accurate enough to think with and not accurate enough to build from. Use them for concept and context, then commission a measured survey before anything is set out. Projects that skip that step usually discover the discrepancy after the structural grid is fixed.
Professional And Paid Tools

ArcGIS Pro
ArcGIS Pro is the commercial standard where GIS work is central, particularly on masterplanning and infrastructure. Its advantage over QGIS is less about capability than about data access, support and the fact that consultants and authorities often work in the same format.
Autodesk Forma
Autodesk Forma works differently: rather than analysing a site once, it runs sun, wind, noise and daylight checks live while you move massing around. That makes it a design tool as much as an analysis one, which suits early options testing.
💡 Pro Tip
Set the coordinate system before you import anything. Mixing a national grid with a global system is the most common reason a site model lands hundreds of metres from where it should, and it is far harder to unpick after several layers are already in place than to set correctly at the start.
Where Do You Find Zoning And Regulatory Data?
This is the layer most often left to the end, and the one most likely to change a scheme. Unlike terrain, it is rarely available from a single global source, so it takes a short search per project.
- Municipal GIS portals. Most cities now publish zoning, height limits and overlays as downloadable layers. Search for the authority name with “open data” or “GIS portal”; this is almost always the authoritative source.
- National mapping agencies supply the accurate contour and boundary data that open datasets approximate. Some charge, many now release at least a coarse tier free.
- Flood and hazard registers are usually held separately from zoning and are worth checking early, because the constraint they impose is absolute rather than negotiable.
- Heritage and conservation registers determine what can be altered or demolished. A listing found late can remove the scheme entirely.
Download these as layers rather than screenshots. A screenshot cannot be overlaid accurately, and it will be redrawn by hand later at a cost far higher than the download.
A Practical Starting Sequence
For a typical project, this order gets a usable analysis together in a working day rather than a week.
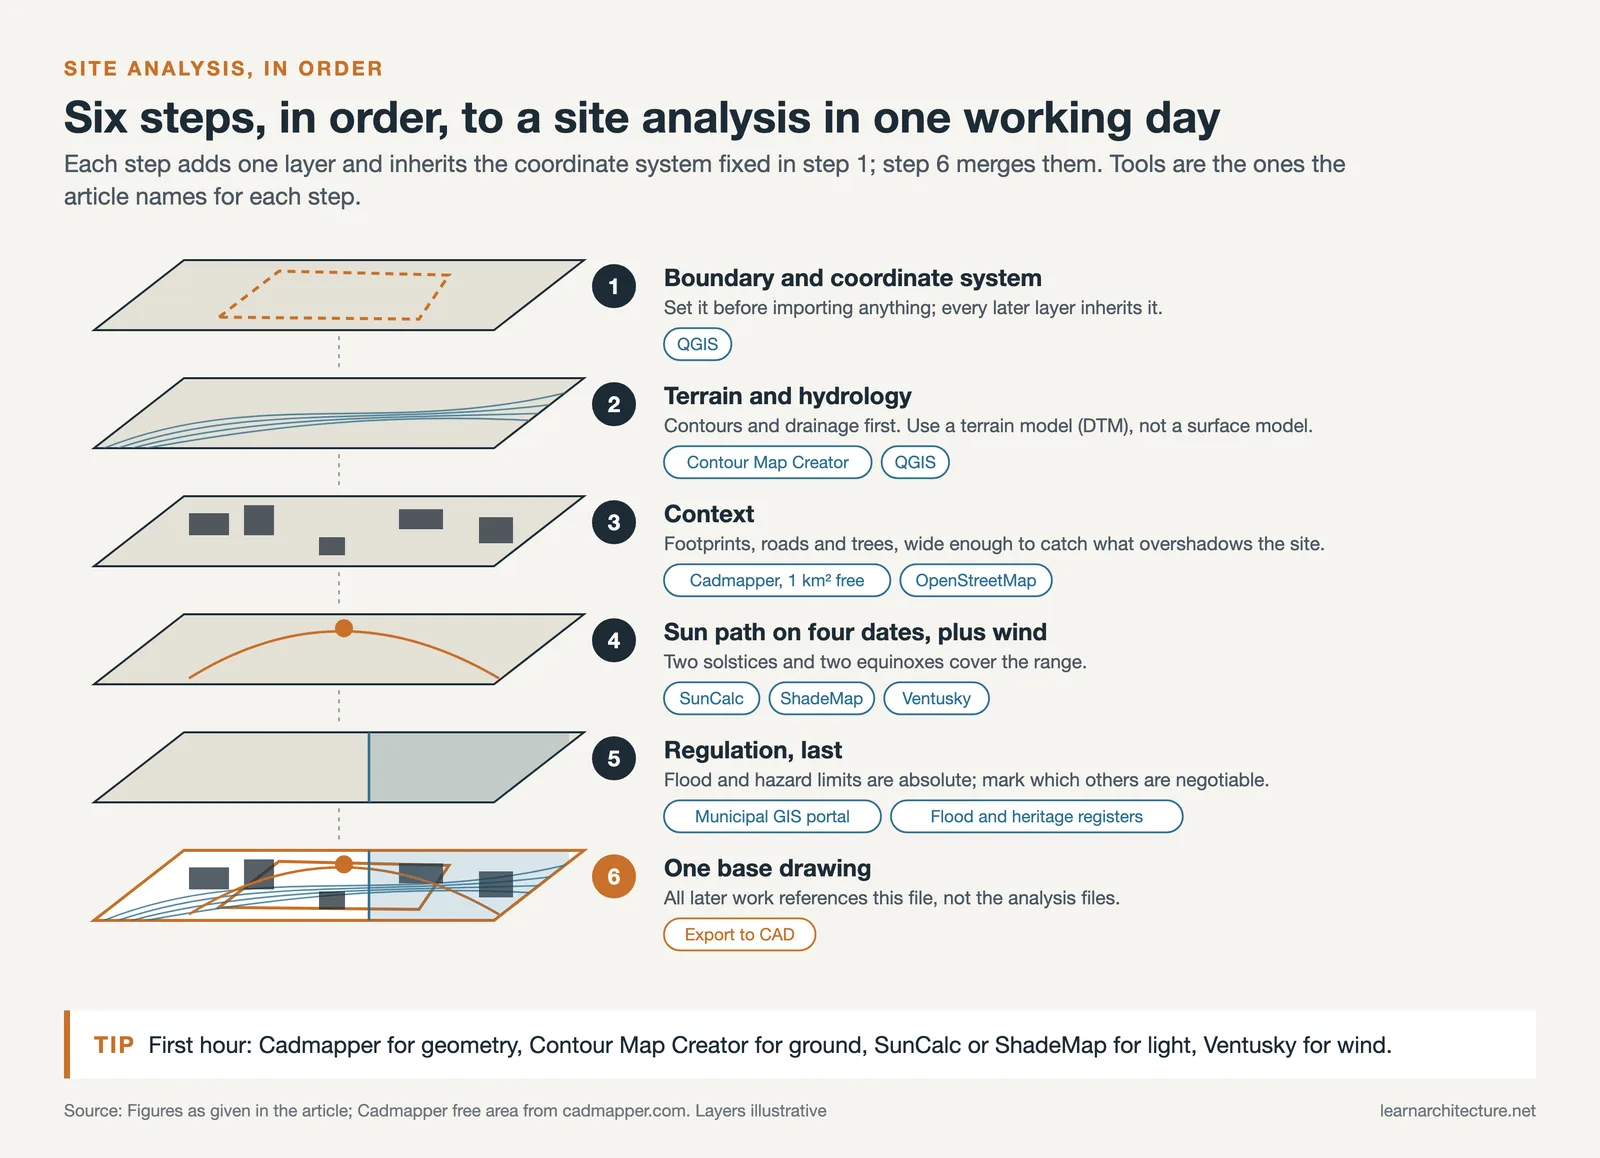
- Fix the boundary and coordinate system. Everything after this inherits it, and correcting it later means re-importing every layer.
- Pull terrain and hydrology. Contours and drainage first, because the ground decides more than anything else on the list and is the hardest to argue with.
- Bring in context. Footprints, roads and vegetation, at a radius wide enough to include whatever overshadows or overlooks the site.
- Run the sun path for four dates. The two solstices and the two equinoxes cover the range; anything else is refinement.
- Overlay the regulatory layers last, and mark which constraints are absolute and which are negotiable. The distinction matters more than the constraint itself.
- Export a single base drawing that all later work references, rather than pulling from the analysis files repeatedly.
Teams that skip the last step end up with several slightly different versions of the site in circulation, which is a slower failure than any of the others but just as expensive.
Getting More Out Of QGIS
Since QGIS does most of the work once it is set up, a few things are worth knowing before the first project rather than after it.
Slope, aspect and hillshade are generated from an elevation raster in a couple of clicks, and together they answer most early questions about buildability. Hillshade in particular reads far better in a presentation than a contour plan does.
The viewshed analysis, which shows what is visible from a given point, is worth learning for any site where views are part of the argument. It also works in reverse, showing where the building will be seen from, which is often the more useful question in a planning context.
Finally, style the layers once and save the project as a template. Site analysis is repetitive across projects, and rebuilding the same set of layer styles each time is the main reason people abandon GIS after one attempt.
Sun, Shadow And Climate Tools
Sun and daylight are usually handled by dedicated software rather than by the mapping tools, because the questions are different: not what is there, but what happens across a year. That family has its own guide, covering daylight analysis software for full simulation and the lighter sun path and shadow study apps for early tests where a quick answer matters more than a precise one.
Site Analysis Tools Compared
| Tool | Cost | Best for | Main limit |
|---|---|---|---|
| QGIS | Free | Layered terrain, hydrology, land use | Steep learning curve |
| Google Earth Pro | Free | Historical imagery, quick shadow read | Not survey accurate |
| OpenStreetMap | Free | Context plans, footprints, roads | Coverage varies by city |
| Cadmapper | Free to paid | Fast CAD and 3D context | Generated, not measured |
| ArcGIS Pro | Paid | Masterplanning, shared workflows | Cost and setup |
| Autodesk Forma | Subscription | Live analysis while massing | Early-stage scope |
Where Free Tools Stop Being Enough
Free tools carry a concept scheme comfortably. Three things push a project toward paid software.

Repetition. Running one analysis is cheap anywhere; running it across twelve massing options is where automation pays for itself.
Accountability is the second. Once analysis output goes into a planning submission, it needs a defensible source and a documented method, and open data with unclear provenance becomes a liability.
Coordination is the third. When engineers, landscape architects and planners all work on the same site, sharing a platform removes a category of translation error that no amount of care fully prevents.
📐 Technical Note
Check what the elevation data actually represents. A digital surface model includes trees and buildings; a digital terrain model strips them back to ground. Slope and drainage studies need the terrain model, and using the surface model instead produces contours that follow the canopy rather than the ground.
AI-Assisted Site Analysis Tools
A separate group of tools uses machine learning to do work that used to require a specialist. They are worth knowing even if you do not adopt them, because they change what is reasonable to expect at concept stage.
- Autodesk Forma (formerly Spacemaker), covered above, is the most established of these. Beyond the live sun, wind and noise checks it also reports microclimate and embodied carbon, which makes it useful precisely when a scheme is still cheap to change.
- Google Earth Engine gives access to decades of satellite imagery and geospatial datasets, which makes it unmatched for regional-scale questions: land cover change over time, seasonal vegetation patterns, water monitoring.
- DroneDeploy turns raw drone footage into orthomosaic maps, digital elevation models, 3D terrain reconstructions and plant-health overlays. For sites with difficult access or significant topography it replaces a survey visit that would otherwise take days.
If budget is the constraint, QGIS provides the most analytical capability for nothing but demands the most skill, and Google Earth Engine offers satellite coverage no paid desktop tool matches at the same price. The realistic pattern for a small practice is a free tool for the heavy analysis and a paid one only where speed at concept stage justifies it.
Building A Workflow Rather Than Collecting Tools
The tool matters less than the order, and the starting sequence above is that order. Analysing regulation before geometry tends to produce a scheme that satisfies the code and ignores the ground.
Automation, including the AI-assisted tools above, helps most in the repetitive middle of that sequence and least at the start, where the boundary and the regulatory reading still need a person to check them.
Bottom line: two free tools and a disciplined order will outperform an expensive platform used without one. Start with QGIS and Google Earth Pro, add the paid options when repetition or accountability demands them.













Leave a comment