

Free Sun Path Diagram Generator
A sun path diagram shows where the sun will be over your site at any hour of any day of the year. Set the latitude and longitude above, or pick a city, and the solar path chart is drawn for you. Nothing is uploaded and no account is needed: the solar position is calculated in your browser with the NOAA algorithm, so the generator keeps working if you lose your connection.
How to use this sun path diagram generator
- Set the site. Pick a city from the list, or type the latitude and longitude of your plot. Southern latitudes are negative, and so are longitudes west of Greenwich.
- Check the UTC offset. It is guessed from the longitude, which is right for most places and wrong wherever a country stretches across time zones. Correct it if the readings look shifted by an hour.
- Move the time slider. The orange dot is the sun. The readings underneath update as you drag: altitude, azimuth, sunrise and sunset bearings, solar noon and day length.
- Jump to the three dates that matter. The Jun 21, Dec 21 and Mar 21 buttons take you to the solstices and the equinox, which between them bracket the whole year.
- Export. SVG stays sharp at any size on a presentation board. PNG is drawn at twice the screen resolution. CSV gives you the sun position every fifteen minutes for a spreadsheet or a shading calculation.
How to read a sun path diagram
In the polar view you are looking straight down at the sky dome from above your site. North is at the top and azimuth runs clockwise, so east is on the right. The outer circle is the horizon and the centre is the zenith, directly overhead. The grey rings are altitude: the closer a point sits to the centre, the higher the sun is in the sky.
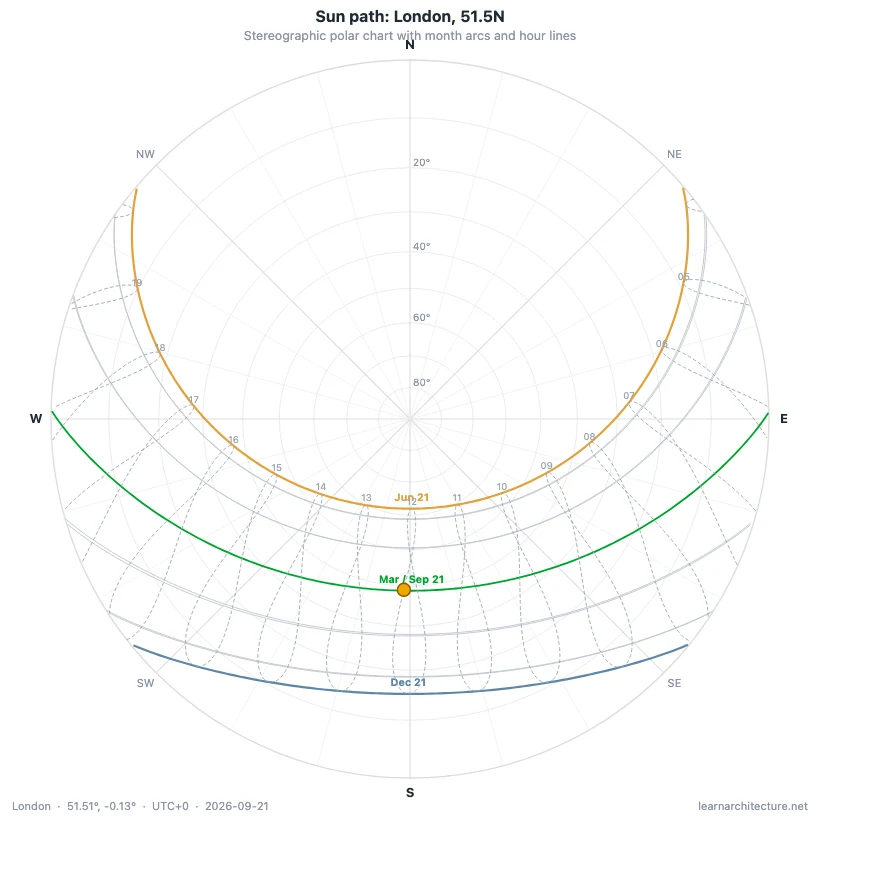
The coloured curves are the path of the sun on a single day. Every other month sits between the solstices in grey. The dashed lines crossing the day curves are hour lines: each one joins the position of the sun at the same clock hour across the whole year, which is why they lean and curve rather than running straight. Where an hour line crosses a day curve, you have the sun position for that hour on that date.
Three readings do most of the work in early design, and the generator prints all three under the chart.
- Solar noon altitude sets the depth of a horizontal shading device. A high summer sun is easy to cut with a shallow overhang. A low winter sun is not, which is why glazing facing the equator can be shaded in July and still admit useful heat in December. That is the same geometry a Trombe wall depends on.
- Sunrise and sunset bearings tell you which parts of the site get low angle light and for how long. In summer at mid latitudes the sun rises well north of east and sets well north of west, so east and west elevations take a long, low, hard to shade beam that a south facing overhang does nothing about.
- Day length is the honest check on a daylighting claim. A room that works in June at 55 degrees north is dealing with a different year than the same room at 25 degrees north.
The cartesian sun path chart, and when to prefer it
The cartesian view unrolls the same information onto a flat chart, with azimuth along the bottom and altitude up the side. It is easier to read exact angles from, and it is the view most people trace when they are drawing a shading mask by hand: you overlay the obstruction profile of the surrounding buildings on the same axes and read off which hours are blocked.
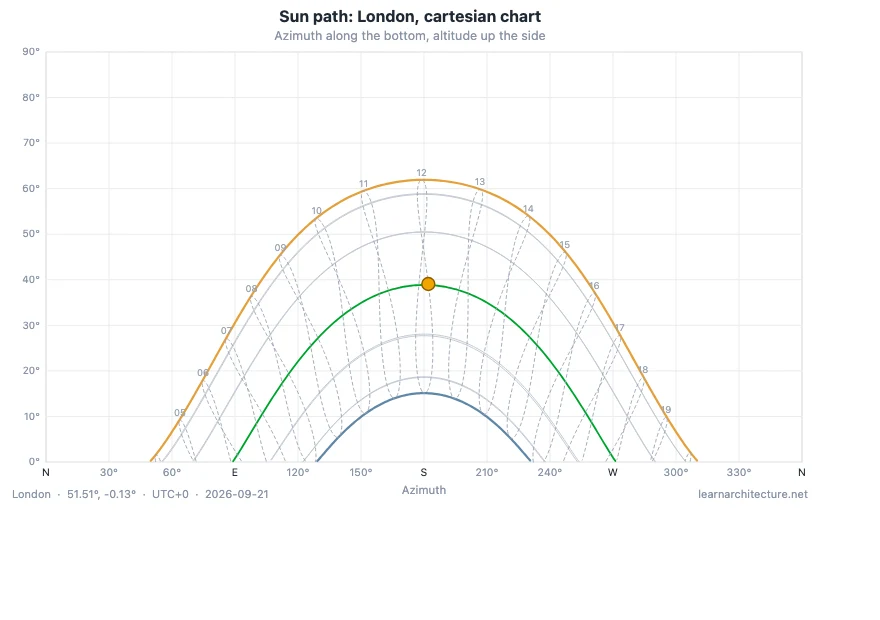
Use the polar chart to understand the shape of the year at a glance, and the cartesian chart when you need a number you are going to put in a drawing.
How latitude changes the sun path
The noon altitude of the sun is 90 degrees minus the difference between your latitude and the declination of the sun on that date. Declination swings between plus and minus 23.44 degrees across the year. That single fact explains why the same building behaves completely differently in three places.
Near the equator
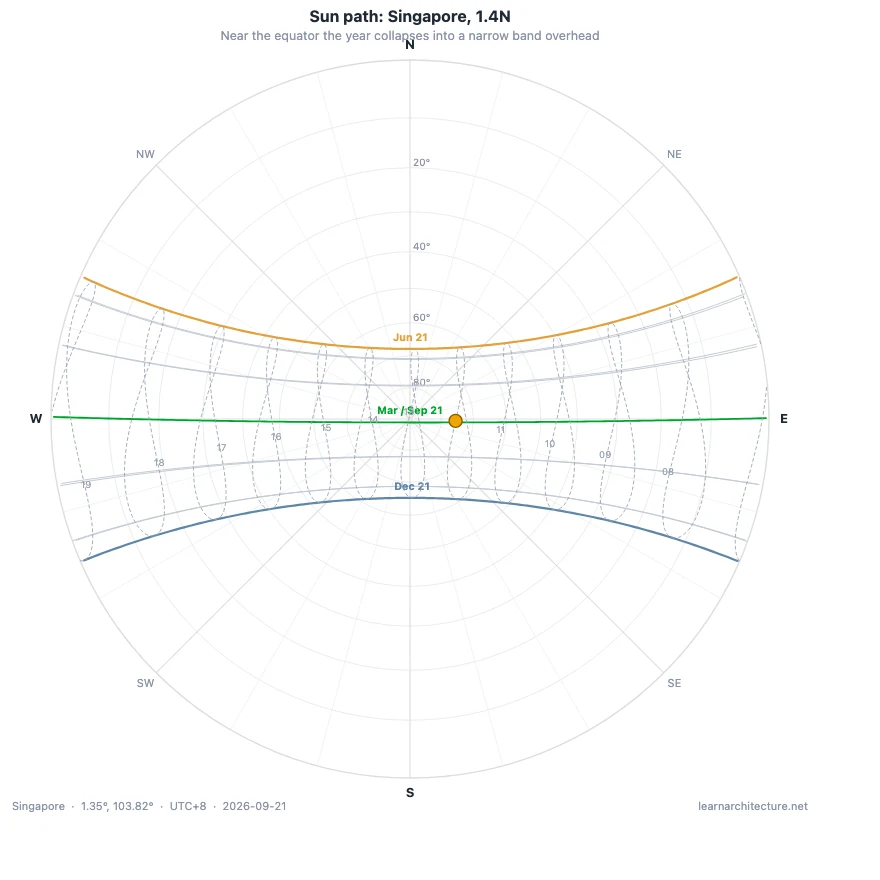
In Singapore the sun is close to overhead at midday all year and the day length barely moves. Horizontal shading is extremely effective and vertical shading is nearly useless at noon, but the low morning and late afternoon sun still arrives almost due east and due west every single day of the year. The design problem is heat, which is where thermal mass and shading strategy have to carry the load, not daylight.
At high latitude
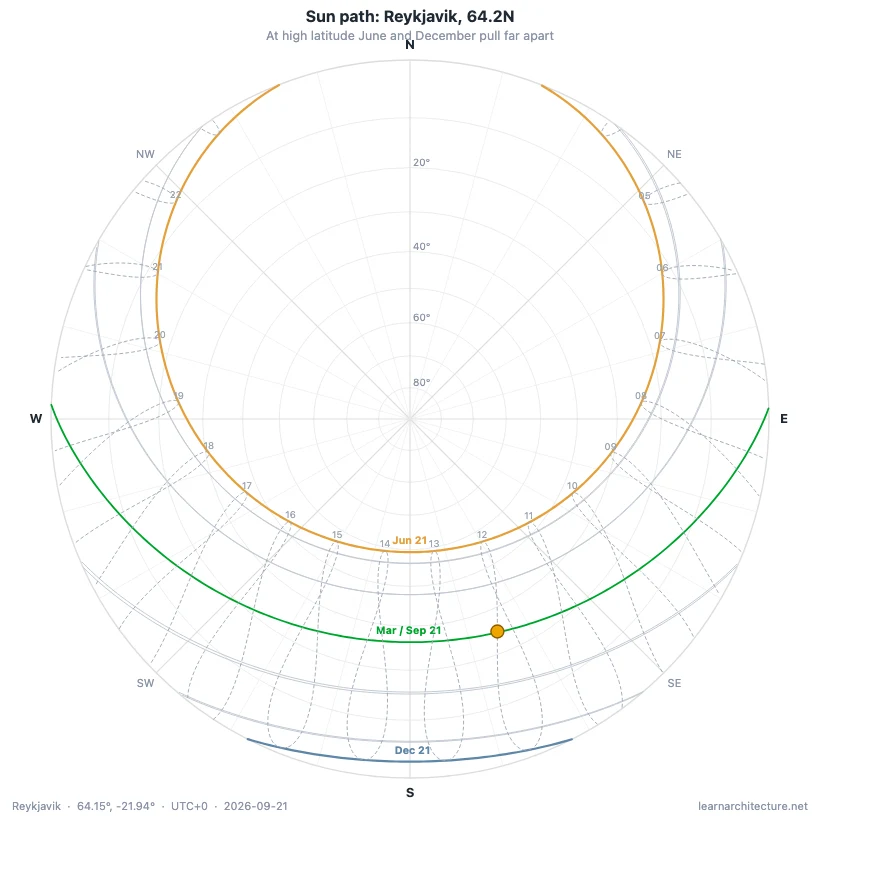
In Reykjavik the two solstices are almost different planets. In June the sun circles the sky and barely sets. In December it scrapes along the southern horizon for a few hours at an altitude that no overhang can usefully shade, which is why glare and low angle penetration, not overheating, drive the facade. Read this together with our guide to the role of light in architecture.
South of the equator
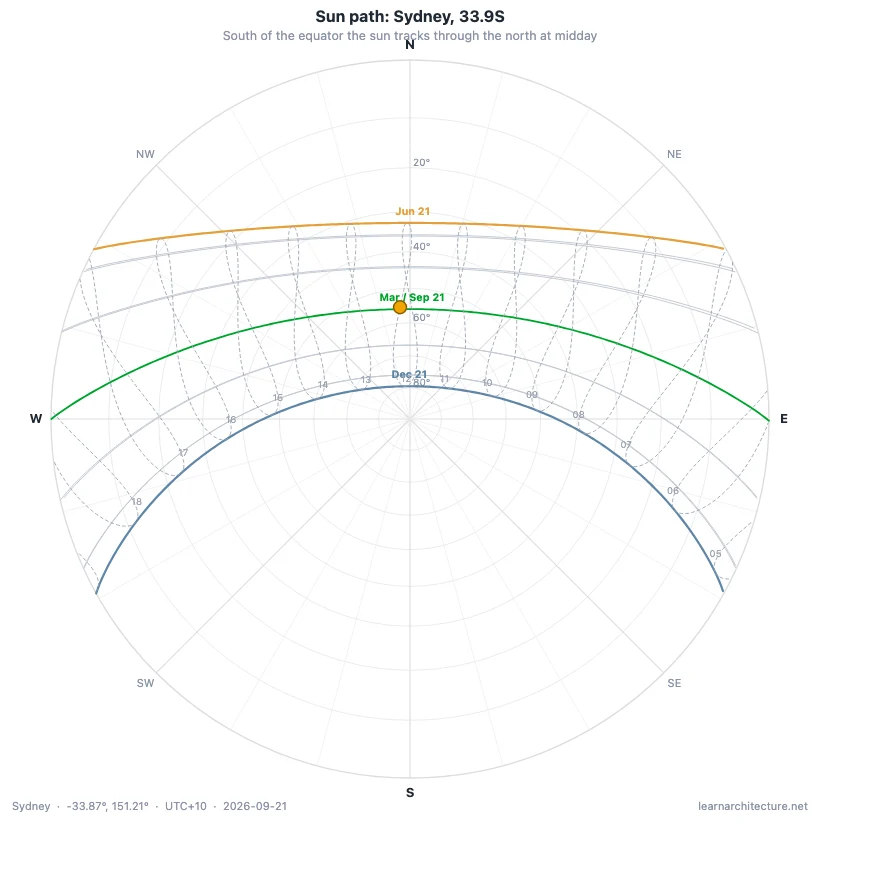
In the southern hemisphere the diagram flips. The midday sun sits in the north, June is the low winter path and December is the high summer one. If you have learned the northern hemisphere rules of thumb, every one of them has to be mirrored, and the generator does that for you as soon as you enter a negative latitude.
Which sun path projection should you choose?
A polar sun path chart has to flatten a hemisphere onto a disc, and there is more than one way to do that. The generator offers three, and they are not interchangeable.
Stereographic is the default and the one most architectural references use. It spreads the area near the horizon out, which is where the shading decisions usually are, and it keeps the shapes of the hour lines readable.
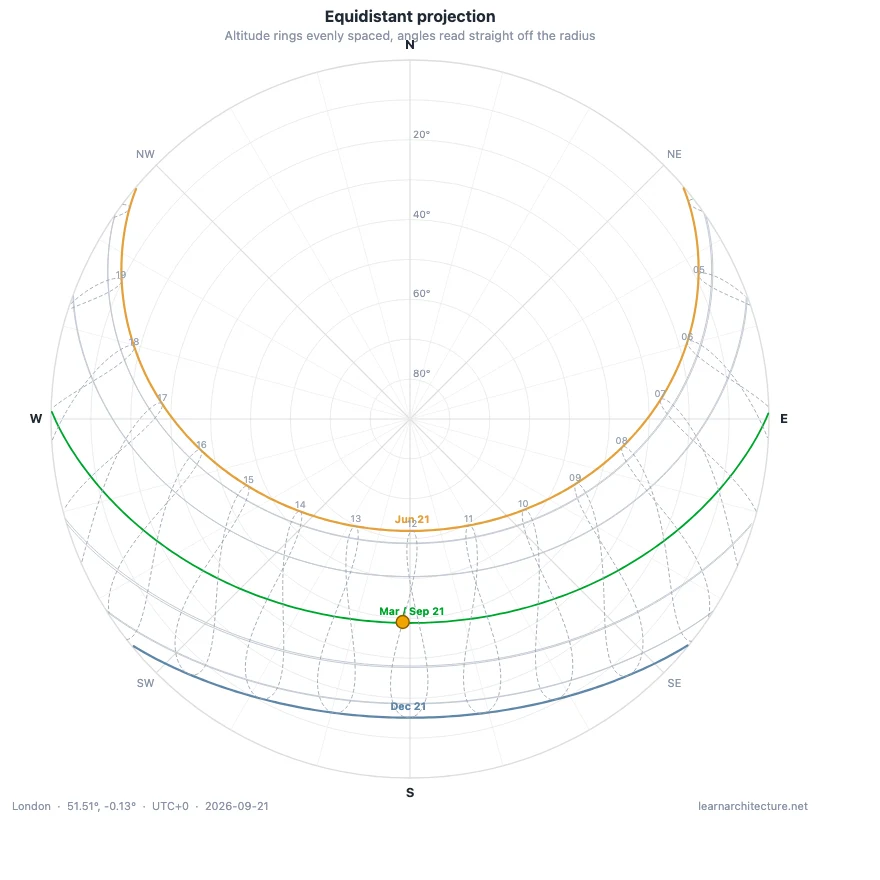
Equidistant spaces the altitude rings evenly, so 45 degrees of altitude sits exactly halfway between the centre and the horizon. That makes measuring angles off a printed chart straightforward, at the cost of distorting the curves near the horizon.
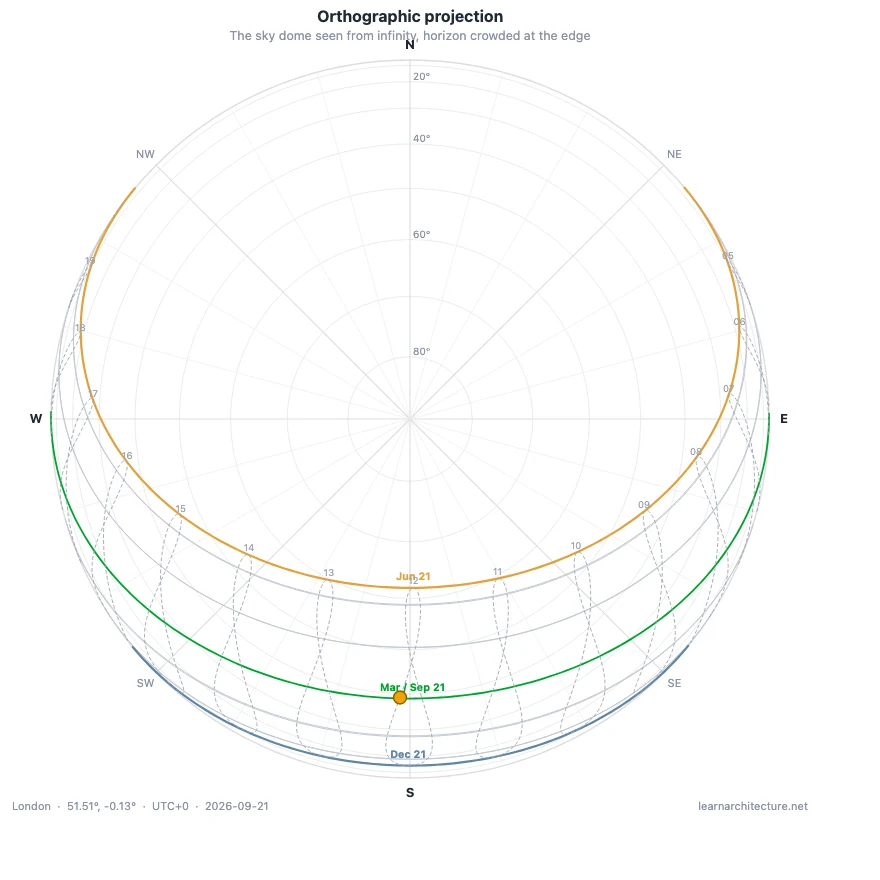
Orthographic shows the sky dome as it would look from infinitely far away. It is the most intuitive as a picture of a dome, but it crowds everything near the horizon into a thin band, which is exactly where you usually need to read. Use it for a presentation image, not for measuring.
Where the sun path sits in a site analysis
Solar geometry is one layer of a site study, not the whole of it. The usual first pass is geometry and context, then ground and topography, then sun, then wind. Our roundup of site analysis tools for architects covers the free browser tools for the other layers, GIS data for urban design and site planning covers the regulatory and demographic layers, and drone survey covers the cases where published data is not good enough.
What this sun path tool does not do
It draws the path of the sun, not the shadows of the buildings around you. If you need to know whether the block opposite blocks your winter sun at three in the afternoon, you need a shadow study on a massing model. The sun path tells you where the sun is; a shadow study tells you whether you can see it. Our roundups of sun path and shadow study apps and daylight analysis software cover the tools that do the second job.
Daylight saving time is not applied. The chart uses standard time for the offset you set, which is the convention for solar charts, so summer clock readings will be one hour behind your watch in countries that shift the clocks.
Nor does it model climate. Knowing that the sun reaches 62 degrees at noon in June tells you nothing about how often it is behind cloud. For that you need local weather data alongside the geometry.
How the calculation works, and how it was checked
Solar position is computed with the NOAA solar calculation equations, including the correction for atmospheric refraction that makes the sun visible while it is still just below the true horizon. That refraction is why day length at the equinox comes out slightly over twelve hours rather than exactly twelve, and why the midnight sun begins a little south of the Arctic Circle rather than exactly on it. The tool reports the boundary honestly: above roughly 65.75 degrees it says midnight sun or polar night instead of printing a sunrise time.
The output was checked against an independently derived algorithm at 379 combinations of latitude, date and hour. Altitude agreed to within 0.013 degrees, and azimuth to within 0.05 degrees away from the zenith, where azimuth stops being a meaningful quantity because the sun is almost directly overhead. It was also checked against the published sunrise and sunset times for Greenwich on the June solstice, which it reproduces exactly: sunrise 04:43, sunset 21:21, noon altitude 61.97 degrees.
Frequently asked questions
What is a sun path diagram?
It is a map of the sky showing where the sun appears from a specific point on earth across a whole year. Because the path depends only on latitude and the date, one diagram covers every site at that latitude.
How do I read altitude and azimuth off the chart?
Altitude is the angle above the horizon, read from the rings: the horizon is zero at the outer circle and the zenith is 90 degrees at the centre. Azimuth is the compass bearing, read clockwise from north at the top, so 90 is east, 180 is south and 270 is west.
Is this sun path diagram maker free?
Yes, and there is no signup. The diagram is generated in your browser, nothing is sent to a server, and you can export it and use it in a project.
Can I use it in the southern hemisphere?
Yes. Enter a negative latitude and the diagram flips: the sun tracks through the north at midday, the June curve becomes the low winter one and December becomes the high summer one.
What happens inside the polar circles?
The tool says so directly. Above roughly 65.75 degrees the sun does not set around the June solstice and does not rise around the December solstice, and the readout reports midnight sun or polar night instead of a sunrise time.
Can I export the diagram for a presentation board?
Yes. SVG is the right choice for a board because it stays sharp at any size, PNG is drawn at twice the screen resolution, and CSV gives you the underlying numbers.


