

Table of Contents Show
To create a zoning diagram, start by listing every space in your project brief, then group them into functional categories such as public, private, service, and circulation. Assign a distinct color to each zone, arrange them based on required adjacencies and separations, and refine the layout until the diagram supports a logical flow of movement and daylight.
A zoning diagram is one of the first drawings you will produce in any design studio project. It sits between the written program brief and your earliest floor plan sketches, acting as a spatial roadmap that tells you which rooms belong together and which ones need distance. Getting this step right saves hours of rework later, because fixing a zone conflict on a simple color-coded diagram is far easier than tearing apart a developed plan. This guide walks through the process from brief analysis to a finished architecture zoning diagram you can pin up for review.

What Is a Zoning Diagram in Architecture?
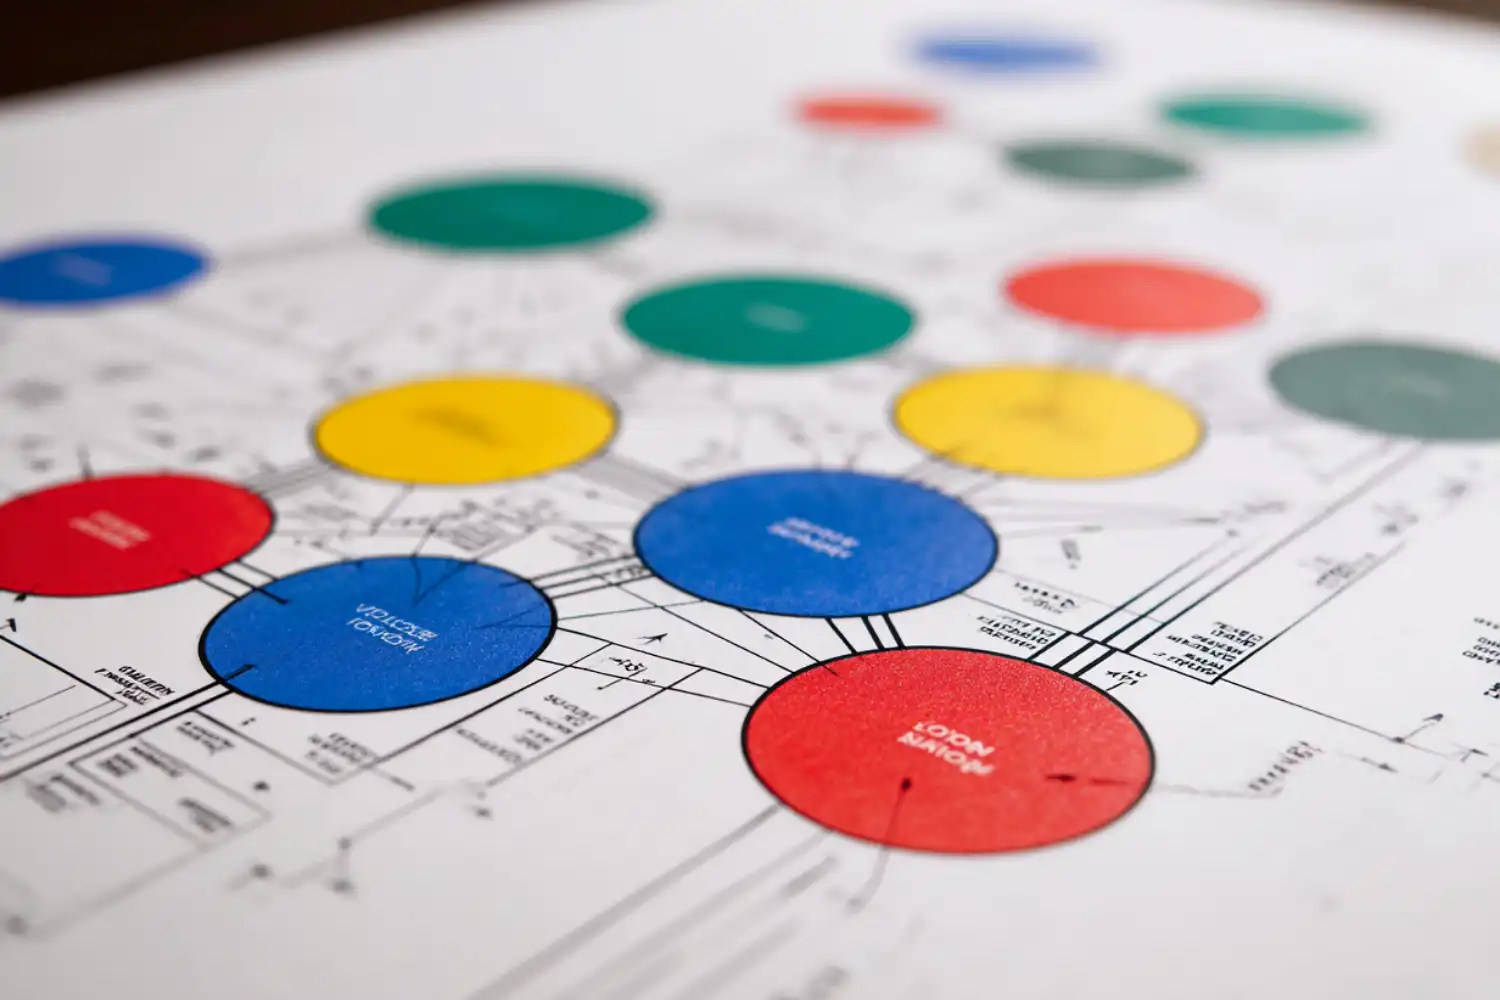
A zoning diagram in architecture is a schematic drawing that organizes a building’s spaces into functional groups and shows how those groups relate to each other. Unlike a floor plan, it carries no exact dimensions or wall thicknesses. Instead, it relies on colored areas, labeled bubbles, and connection lines to communicate hierarchy, adjacency, and separation at a glance.
Think of it as the translation layer between a text-based program (the list of rooms with their required areas) and a geometric layout. The architect reads the brief, identifies the required spaces, and sorts them into zones: public areas like lobbies and reception, private areas like bedrooms or offices, service areas like kitchens and mechanical rooms, and circulation zones like corridors and stairwells. Each zone receives a color or pattern, and the resulting diagram reveals whether the proposed arrangement supports the intended movement of people through the building.
Zoning diagrams belong to a broader family of architectural diagrams that also includes bubble diagrams, parti diagrams, and concept diagrams. The key difference is scope: a zoning diagram focuses specifically on functional grouping, while a parti diagram captures the overarching design idea.
📌 Did You Know?
The concept of spatial zoning in architecture dates back to the Beaux-Arts tradition, where students at the Ecole des Beaux-Arts in Paris were required to produce an esquisse (quick sketch) that resolved the programmatic zoning of a building within a strict time limit. This exercise trained architects to think in zones before lines, a principle that remains central to design education today.

Why Architecture Students Need Zoning Diagrams
Studio critics and jury panels look for clear spatial logic in student projects. A well-structured architectural zoning diagram demonstrates that you understand the program, have thought about user flow, and can justify your layout decisions. Without one, your floor plan risks feeling arbitrary, with rooms placed where they fit rather than where they belong.
Zoning diagrams also catch problems early. If your diagram shows the kitchen sitting three zones away from the dining area, or places a noisy mechanical room directly beside a quiet reading space, you can fix that conflict in minutes rather than redrawing entire plans. For group projects, a shared zoning diagram keeps all team members aligned on the spatial strategy before individual drawing begins.
How to Create a Zoning Diagram Step by Step
Step 1: Read and Break Down the Project Brief
Start by reading the entire brief twice. On the first pass, highlight every named space and its required area. On the second pass, note any adjacency requirements the brief specifies (for example, “the reception area must connect directly to the main corridor”) and any separation requirements (“the workshop must be isolated from the library due to noise”). List every space in a simple table with three columns: space name, approximate area, and zone category.

Step 2: List All Required Spaces and Assign Zones
Group the spaces from your table into functional zones. A residential project might use four zones: living (public), sleeping (private), cooking and utility (service), and hallways and stairs (circulation). A mixed-use building could have six or more zones. There is no single correct number of zones; the goal is to create groups where all spaces within a zone share a similar function, noise level, or access requirement.
💡 Pro Tip
Keep your zone count between three and six for most student projects. Going beyond six zones often fragments the diagram and makes adjacency relationships harder to read. If you find yourself with eight or nine zones, look for categories you can merge without losing functional clarity.
Step 3: Choose a Color-Coding System
Assign one color per zone. Pick colors that are visually distinct from each other, not three shades of blue for three different zones. A reliable starting palette: warm red or orange for public zones, cool blue for private zones, green for service areas, and yellow or light gray for circulation. Stick to flat, solid fills rather than gradients, since gradients reproduce poorly in printed pin-ups. Label each color in a legend placed at the corner of your diagram.
If your project has more than five zones, consider using hatching or patterns alongside color to maintain readability for viewers with color vision differences. The American Institute of Architects (AIA) recommends accessible graphic standards in all architectural documents, including schematic diagrams.

Step 4: Map Adjacencies and Separations
This is where the diagram earns its value. Draw your zones as rough shapes (rectangles, circles, or bubbles) on a blank page. Position zones that need direct access next to each other. Zones that require separation should sit on opposite sides of the diagram with circulation or buffer space between them.
Use solid lines to indicate required adjacencies and dashed lines for preferred (but not mandatory) connections. Mark any hard separations with a double line or a small “X” symbol. At this stage, do not worry about exact proportions. The diagram should communicate relationships, not dimensions.
⚠️ Common Mistake to Avoid
Many students skip the adjacency analysis and jump straight to drawing colored blobs on a site plan. Without mapping which zones need to connect and which need separation first, the diagram becomes decoration rather than a design tool. Always complete the adjacency matrix or list before picking up your pen.
Step 5: Test and Refine Your Diagram
Once your initial zoning diagram is down, run a quick mental walkthrough. Imagine a user entering the building: Can they reach the main public spaces without crossing through private zones? Does the service access (deliveries, maintenance) operate independently of the main circulation? If the answer to either question is no, adjust the zone positions and re-test.
Produce at least two or three variations of your architectural zoning diagram before selecting a final version. Each variation should test a different spatial strategy, such as a linear arrangement versus a courtyard scheme. Comparing options side by side gives you stronger arguments during a design review and often reveals possibilities you would not have considered with a single attempt.
💡 Pro Tip
Use trace paper overlays when hand-drawing your zoning diagrams. Layer one sheet for zones, another for circulation arrows, and a third for daylight paths. This separation lets you test each system independently and combine them for a clear composite view during your pin-up presentation.

Tools for Drawing Architectural Zoning Diagrams
You do not need expensive software to create a zoning diagram. Many students start with pen, trace paper, and colored markers, which is fast and encourages quick iteration. For digital diagrams, Adobe Illustrator gives precise control over colors and line weights. Free alternatives like Figma or Canva also work well for simple zone layouts.
If your studio uses BIM tools, both Revit and ArchiCAD allow you to create color-coded area plans directly from your building model. For early-stage exploration, dedicated diagramming tools such as Miro or draw.io let you drag and drop shapes quickly without worrying about architectural drafting conventions.
How Does a Zoning Diagram Fit into the Design Process?
A zoning diagram typically comes after the concept diagram and before the first floor plan sketch. In a standard design studio sequence, you would analyze the site, develop a concept or parti, then create a zoning diagram to test how the concept translates into a functional layout. The zones you establish here directly inform room placement, corridor routing, and structural grid alignment in the next phase.
Projects featured on platforms like ArchDaily frequently include zoning diagrams in their presentation boards, showing how professional firms use these drawings to communicate spatial logic to clients and planning committees.

Where to Go From Here
Your Next Step: Pick your current studio project, list every space from the brief in a simple spreadsheet, and group them into three to five functional zones with assigned colors. Sketch at least two different zoning arrangements on trace paper before your next studio session, then bring both to your desk crit for comparison.
Frequently Asked Questions
How is a zoning diagram different from a bubble diagram?
A zoning diagram groups spaces into broad functional categories (public, private, service, circulation), while a bubble diagram assigns an individual bubble to each specific room. Zoning diagrams work at a higher level of abstraction and are typically produced first. The bubble diagram then breaks each zone into its individual spaces with approximate proportional sizes.
What software works best for creating zoning diagrams?
For hand-drawn diagrams, colored markers and trace paper remain the fastest option. Digitally, Adobe Illustrator and Figma offer the most control over colors and layout. If you already work in Revit or ArchiCAD, both programs include area plan tools that can generate color-coded zone maps directly from your model.
How many zones should a zoning diagram include?
Most student projects work well with three to six zones. Residential projects often use four (living, sleeping, service, circulation), while larger public buildings may need five or six. More than six zones can make the diagram difficult to read, so consider merging closely related categories when the count grows too high.
Can I create a zoning diagram without knowing the site?
Yes. A zoning diagram primarily addresses internal programmatic relationships, not site-specific constraints. You can establish which zones need adjacency and which need separation based on the project brief alone. Once you overlay the diagram onto the site, you will adjust orientations for sunlight, views, and access points, but the core zone logic stays intact.


Leave a comment