



Table of Contents Show
A zoning diagram is a schematic drawing that groups a building’s spaces into functional categories and maps how those categories relate to each other. It sits between the written program brief and the first floor plan, helping architects prevent layout mistakes before any walls are drawn.
Every architecture project starts with a question: which rooms belong together, and which ones need separation? A residential kitchen should connect to the dining area, not to a bedroom hallway. A hospital’s sterile zone cannot share a corridor with the public lobby. The zoning diagram answers these questions visually, using color-coded zones, adjacency lines, and labeled bubbles to organize the program before dimensions enter the picture. For students, learning to build a clear architectural zoning diagram early in the design process saves hours of rework during schematic design and helps communicate ideas to tutors and juries with confidence.
What Is a Zoning Diagram in Architecture?
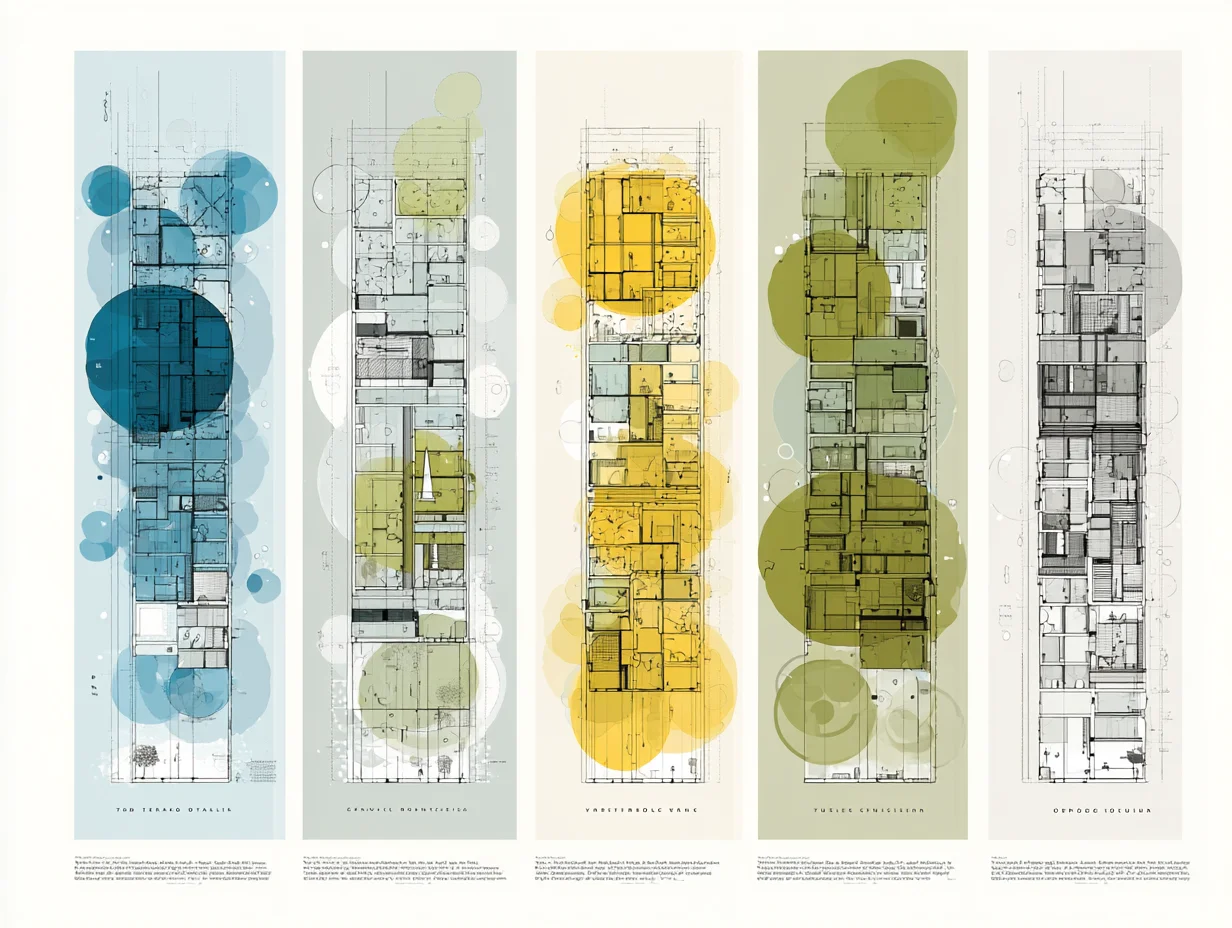
A zoning diagram in architecture is a simplified, non-dimensional drawing that sorts a building’s required spaces into functional groups. Unlike a floor plan, it carries no exact measurements. Instead, it relies on shapes, colors, and connector lines to show hierarchy, adjacency, and separation between zones such as public, private, service, and circulation areas.
Think of it as the first translation layer between a text-based brief and a spatial layout. The architect reads the brief, identifies required rooms and their square footage targets, then clusters them into zones. Each zone receives a distinct color or hatch pattern. Lines or arrows between zones indicate which ones need direct access to each other, while physical distance on the diagram signals separation. This visual shorthand lets the entire design team, including consultants and clients, review the proposed organization at a glance before committing to geometry.
💡 Pro Tip
Keep your first zoning diagram to a single sheet and limit yourself to four or five zone categories. Students often try to represent every individual room as its own zone, which defeats the purpose. Group related spaces (all bedrooms = private zone, kitchen + dining = social zone) and refine later during bubble diagramming.
Zoning diagrams apply at multiple scales. At the urban level, municipal zoning maps designate residential, commercial, and industrial districts across a city. At the building level, the same logic helps separate a school’s noisy gymnasium from quiet classrooms, or keep a restaurant’s kitchen service path away from the guest entrance. Regardless of scale, the core principle remains identical: group related functions, separate conflicting ones, and connect everything with logical circulation.
Types of Architectural Zoning Diagrams
Not every zoning diagram looks the same. The type you choose depends on the project phase, the audience, and the information you need to communicate. Below are eight common types that architecture students should know.
Functional Zoning Diagrams
A functional zoning diagram is the most basic type. It divides the building program into broad use categories, typically public, private, service, and circulation. Each category gets a color, and the diagram shows which categories sit adjacent to each other. This is usually the first diagram a student produces after reading the brief.
Zoning Bubble Diagrams
A zoning bubble diagram replaces hard-edged zones with proportional bubbles. The size of each bubble roughly represents the area allocation for that space, and overlapping or touching bubbles indicate adjacency. Lines between bubbles show required connections, while gaps signal separation. Bubble diagrams are fast to sketch by hand and easy to revise, making them a studio favorite for early design charrettes.
Circulation Overlay Diagrams
This type layers movement paths on top of a zoning layout. Arrows indicate primary and secondary circulation routes, entry points, and emergency exits. Circulation overlays help students check whether people can move through the building logically without crossing through private zones or dead-ending in service corridors.
Vertical Zoning Diagrams
For multi-story buildings, a vertical zoning diagram stacks zones across floors. It shows which functions sit on which level and how vertical circulation (stairs, elevators, ramps) connects them. This type is especially useful for mixed-use projects where retail occupies the ground floor, offices fill the middle floors, and residential units sit on top.
Adjacency Matrix Diagrams
An adjacency matrix is a grid-based chart that lists every space along both axes. Each intersection cell is marked to show whether two spaces need to be adjacent, nearby, or separated. While not a spatial diagram in the visual sense, the matrix feeds directly into the bubble or functional zoning diagram by quantifying relationships before you start drawing. For a broader look at how different architecture diagrams fit together in the design process, review the step-by-step guide on diagram types.
Public-Private Gradient Diagrams
This type arranges zones along a spectrum from fully public to fully private rather than grouping them by function. A museum progresses from the public lobby through semi-public galleries into staff-only conservation labs and finally to secure storage. Plotting that gradient on one diagram is the fastest way to check that privacy increases logically as you move deeper into the building, and to catch the moment where a visitor route accidentally crosses a restricted one.

Environmental Zoning Diagrams
Environmental diagrams group zones by daylight access, acoustic requirement, thermal comfort or ventilation need rather than by programme. Grouping spaces with similar thermal loads is what keeps an HVAC layout from becoming unnecessarily complicated, which is why this diagram usually pays for itself later. In practice it places the spaces that benefit from passive solar gain on the south side and pushes heat-generating rooms such as server or plant spaces to the cooler north.
Programmatic Zoning Diagrams
Programmatic diagrams translate the written brief into proportional zones, so bubble or block size corresponds to the area each space actually needs rather than to its importance. This is the type that bridges the gap between a programme document and a floor plan, and it is usually the one that reveals that the brief does not fit the site.
Comparison of Zoning Diagram Types
The following table summarizes when and why to use the first five types:
| Diagram Type | Best For | Tools | Output Level |
|---|---|---|---|
| Functional Zoning | Initial program sorting | Pen and paper, Illustrator | Schematic |
| Bubble Diagram | Area allocation and adjacency | Hand sketch, Miro, Figma | Conceptual |
| Circulation Overlay | Movement path verification | AutoCAD, Illustrator | Schematic to detailed |
| Vertical Zoning | Multi-story organization | SketchUp, Revit, section sketch | Schematic |
| Adjacency Matrix | Quantifying spatial relationships | Excel, hand-drawn grid | Pre-diagram data |
How to Create a Zoning Diagram Step by Step

Building a zoning diagram follows a repeatable sequence. Whether you draw by hand or work digitally, these steps keep the process structured and efficient.
Step 1: Analyze the Program Brief
Start by reading the brief carefully and listing every required space with its approximate area. Group spaces that share a function or user profile. A house brief might list living room, dining room, kitchen, pantry, three bedrooms, two bathrooms, a home office, a garage, and a laundry room. Group these into zones: social (living, dining, kitchen, pantry), private (bedrooms, bathrooms), work (home office), and service (garage, laundry). The clearer your grouping, the simpler the next steps become.
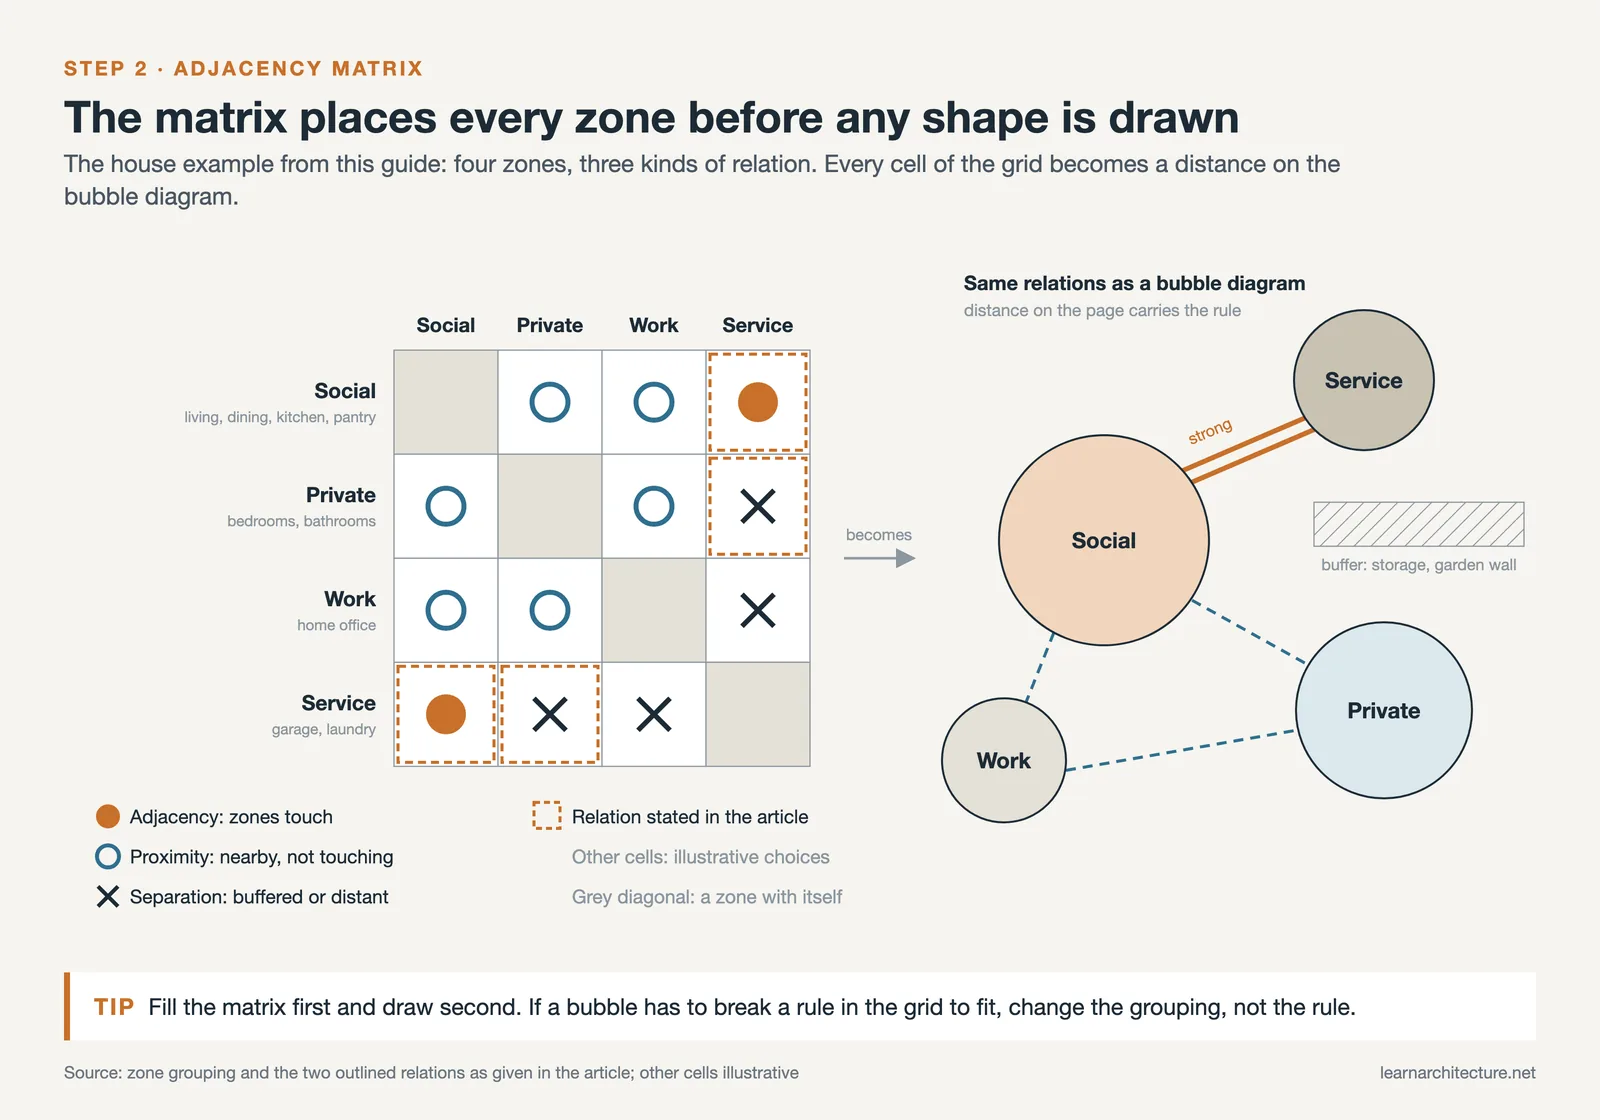
Step 2: Build an Adjacency Matrix
Create a simple grid listing all zones along both axes. At each intersection, mark whether two zones need direct adjacency (strong connection), proximity (nearby but not touching), or separation (buffered or distant). For the house example, the social zone needs a strong connection to the service zone (kitchen to pantry path), while the private zone needs separation from the garage to reduce noise transfer. This matrix becomes the rulebook for your diagram layout.
Step 3: Sketch the Initial Zoning Layout
Using tracing paper or a digital canvas, place zone shapes on the page according to the adjacency matrix. Zones with strong connections should touch or overlap slightly. Zones requiring separation should sit apart, with circulation or buffer space between them. Do not worry about precise geometry at this stage. The goal is spatial logic, not architectural form. If you are working on a bubble diagram for an architectural project, represent each zone as a proportional bubble rather than a rectangle.
⚠️ Common Mistake to Avoid
Many students jump straight from the brief to a floor plan without creating a zoning diagram first. This skips the organizational step that catches adjacency conflicts early. Placing bedrooms next to the kitchen or positioning a library beside a gym becomes obvious on a zoning diagram but can go unnoticed in a floor plan where walls and furniture distract from the underlying logic.
Step 4: Apply Color Coding
Assign a distinct color to each zone category. A widely used convention is blue for public zones, yellow or warm tones for private areas, green for service spaces, and gray or hatching for circulation. Consistency matters more than the specific palette. Once you pick colors, use them across every diagram in the project so that tutors and jurors can read your drawings without re-learning the legend each time. For guidance on choosing effective colors in architectural presentations, review the color theory principles that improve readability.
Step 5: Add Circulation and Connections
Draw arrows or dashed lines to indicate primary movement paths between zones. Mark the main entry point, secondary entries (service entrance, garden access), and vertical circulation if the project has multiple levels. Check that every zone is reachable without passing through an unrelated zone. A visitor should not need to walk through a bedroom wing to reach the living room.
Step 6: Review Against Site Constraints
Overlay your zoning diagram onto the site orientation. Place zones that benefit from south-facing sunlight (living areas in the northern hemisphere) on the appropriate side. Position service zones toward the access road for deliveries. Check setback lines, noise sources, and views. A thorough site analysis should inform where each zone lands on the plot, not just how zones relate to each other internally.
🎓 Expert Insight
A zoning diagram is not a small plan but a thinking tool. The moment dimensions appear, attention shifts from relationships to walls.
That is why zoning diagrams should stay abstract. Their value lies in testing spatial relationships before committing to geometry, which is exactly the mindset architecture students need during early design phases.
Zoning Diagram for Different Building Types
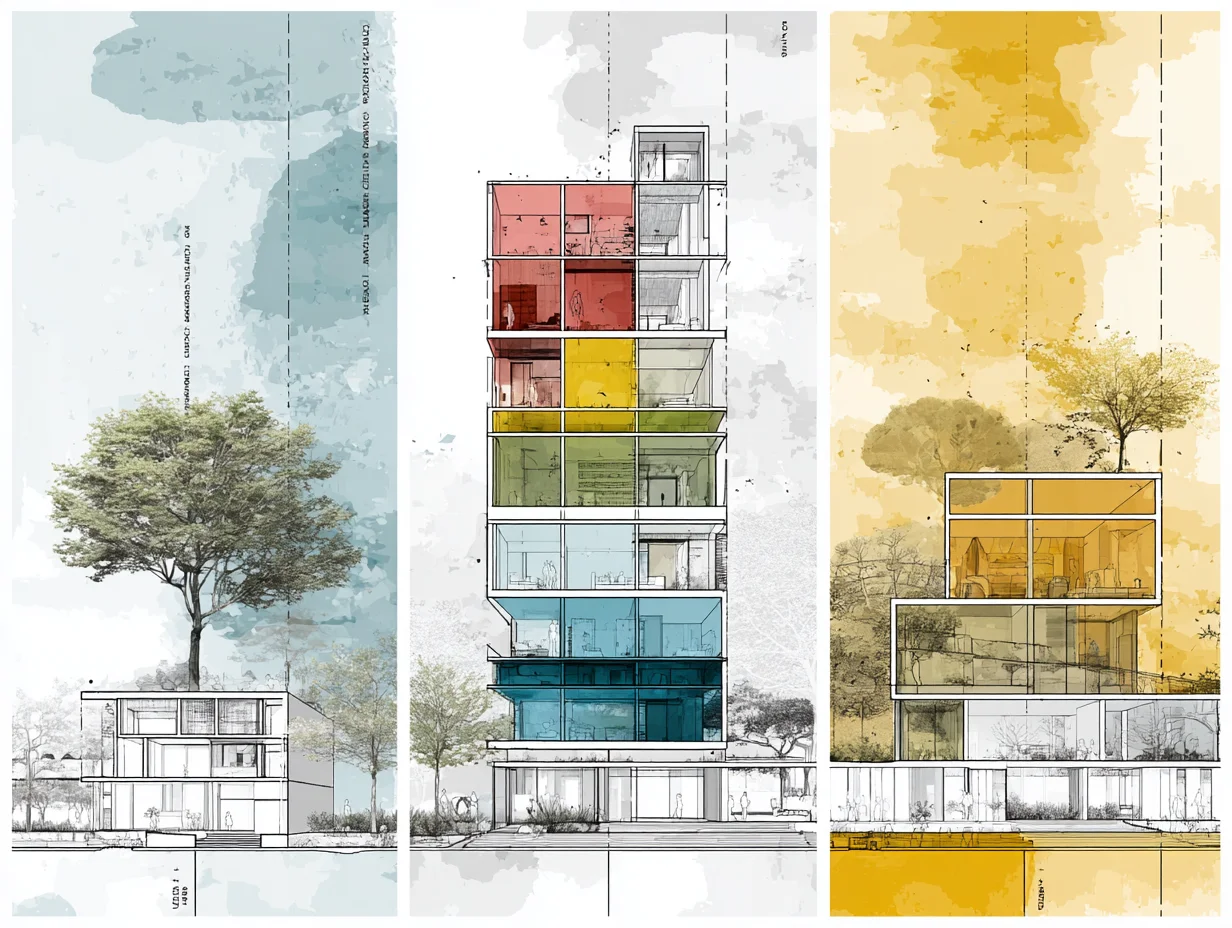
The zone categories change depending on the project type. A house zoning diagram and a hospital zoning diagram share the same method but require very different functional groupings.
House Zoning Diagram
A house zoning diagram typically uses three to four zones: social (living, dining, kitchen), private (bedrooms, bathrooms), service (laundry, storage, garage), and outdoor (garden, terrace). The social zone anchors the plan and connects to the outdoor zone for natural extension. The private zone sits deeper in the plan, shielded from street noise and the main entrance. Service spaces line the edges or back of the house for functional access without interrupting daily life.
Interior Design Zoning Diagram
For interior designers, the zoning process focuses on how a single floor plate or open-plan space gets divided into activity areas. An interior design zoning diagram for a co-working space might separate focused work pods, collaborative meeting zones, social lounges, and support areas (kitchenette, restrooms, storage). Unlike a building-scale diagram, the interior version often deals with furniture placement and acoustic zoning rather than walls. Exploring how bubble diagrams apply to interior design can help students bridge the gap between architectural and interior zoning approaches.
Master Plan Zoning Diagram
A master plan zoning diagram operates at the urban or campus scale. It maps land-use categories such as residential, commercial, institutional, recreational, and infrastructure across a site. Each category receives a color, and the diagram shows how districts connect through road networks, pedestrian paths, and green corridors. Students working on urban design studios use master plan zoning diagrams to test density distribution, mixed-use adjacencies, and public open space allocation before developing individual building footprints.
💡 Pro Tip
When presenting zoning diagrams in a studio review, always include a small legend in the corner that maps colors to zone names. Tutors review dozens of projects in a single session, and a missing legend forces them to guess what each color represents, which weakens your presentation impact.
Best Tools for Creating Zoning Diagrams
You do not need expensive software to produce a clear zoning diagram. The right tool depends on your workflow, your comfort level, and how polished the final output needs to be.
Hand sketching on tracing paper remains the fastest method for early-stage ideation. You can test multiple zone arrangements in minutes, overlay them on a site plan, and iterate without any learning curve. For digital production, Adobe Illustrator gives full control over shapes, colors, and line weights. Figma and Miro work well for collaborative projects where multiple students edit the same diagram remotely. Archisoup’s guide on architecture zoning diagrams offers additional examples of how professionals structure their diagrams using both analog and digital methods.
For students who already work in concept diagram workflows, tools like SketchUp and Revit can generate three-dimensional zoning models that show vertical relationships across floors. These 3D zoning views are particularly useful during jury presentations where a flat diagram cannot communicate stacking logic clearly enough.
📌 Did You Know?
The concept of functional zoning in architecture traces back to the 1933 Athens Charter, drafted during the fourth CIAM (Congres Internationaux d’Architecture Moderne) congress. The charter proposed separating cities into distinct zones for living, working, recreation, and transportation. While many of its rigid zoning principles have since been criticized for producing isolated urban districts, the underlying method of categorizing spaces by function remains the foundation of every zoning diagram architects produce today.
How to Present Zoning Diagrams in Architecture

A well-built zoning diagram loses value if it is poorly presented. Students need to treat the diagram as a communication piece, not just a working sketch. Place the zoning diagram early in your site analysis presentation sequence, right after the site analysis and before the concept diagram. This position shows reviewers the logical bridge between site data and design decisions.
Use consistent line weights: thicker lines for zone boundaries, thinner lines for adjacency connections, and dashed lines for optional or secondary relationships. Label each zone directly on the diagram rather than relying solely on color. Add a north arrow and a simple scale reference if the diagram is overlaid on a site plan. Keep annotations short and factual.
For parti diagrams, the zoning diagram often serves as the spatial evidence behind the concept. If your parti says “public gradient from street to garden,” the zoning diagram should visually prove that public zones face the street while private zones face the garden. This alignment between parti and zoning strengthens the entire project narrative.
✅ Key Takeaways
- A zoning diagram organizes a building’s program into functional zones before any floor plan geometry begins.
- Eight main types exist: functional, bubble, circulation overlay, vertical, adjacency matrix, public-private gradient, environmental, and programmatic. Choose based on project phase and audience.
- Follow a six-step process: analyze the brief, build an adjacency matrix, sketch zones, apply color coding, add circulation, and review against site constraints.
- Keep diagrams abstract. The moment you add dimensions or wall thicknesses, the diagram stops being a thinking tool and becomes a premature floor plan.
- Always include a color legend and place zoning diagrams between the site analysis and concept diagram in your presentation sequence.
Zoning Diagram or Land-Use Zoning? Two Different Things
The word zoning carries two meanings in architecture and they are regularly confused, including in briefs. The diagrams described above are an internal tool: they organise the spaces of one building. Land-use zoning is an external, legal framework set by a municipality that governs what may be built on a plot at all. You will meet both, and a diagram that answers one while the reader is asking about the other wastes everyone’s time.
What land-use zoning controls
Municipal zoning classifies land by permitted activity, most commonly into residential areas covering everything from single-family houses to apartment blocks, commercial areas for retail, offices and services, and industrial areas for manufacturing and warehousing. Mixed-use and civic designations sit between them. These classifications decide what is legal before any design question is asked.
The regulations that come with it
Alongside use, a zoning ordinance sets the dimensional rules a scheme has to satisfy:
- Setbacks: the minimum distance a structure must keep from each property line, which protects light, air and privacy between plots.
- Height restrictions: limits that control sightlines and hold the character of a street or neighbourhood.
- Density requirements: the permitted number of units per area, which drives population density and, indirectly, parking and services.
- Coverage and floor area ratios: how much of the plot may be built on and how much total floor area it may carry.
Check these before the internal zoning diagram, not after. A functional layout that violates a setback is not a layout, and finding that out at planning stage is expensive.
Where stakeholders come in
Municipal zoning work is collaborative in a way building diagrams are not. Architects, developers, city planners and community representatives all have standing, and the diagram becomes the shared object they argue over. Workshops and documented feedback are worth the time here: a scheme that has absorbed objections early is far harder to stop later.
Working Example: Zoning a Medical Clinic
A mid-size medical clinic makes the method concrete. The brief calls for a reception area, examination rooms, a procedure suite, staff offices and building services. A functional zoning diagram colour-codes these into four zones: public, clinical, administrative and service.
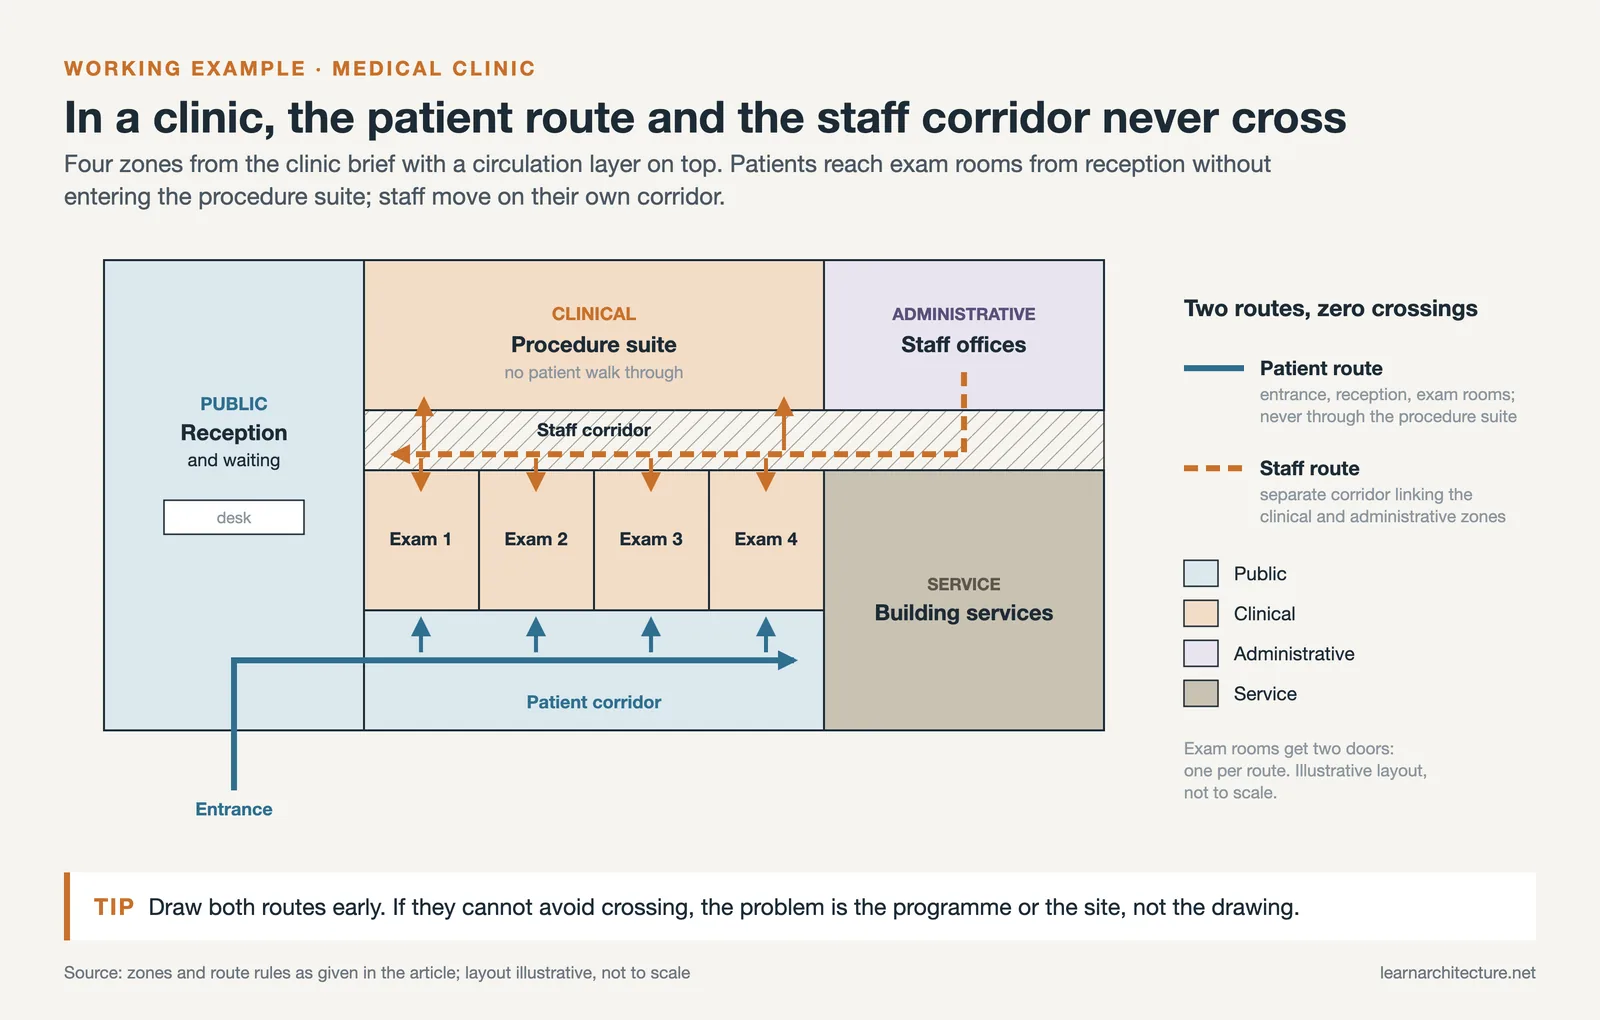
Layering a circulation diagram on top is where the diagram earns its place. It shows immediately that patients must reach examination rooms from reception without passing through the procedure suite, and that staff need a separate corridor linking the clinical and administrative zones. Neither requirement is obvious from the written brief, and both are expensive to discover once the plan is drawn.
If the diagram cannot resolve those two routes without crossing, the problem is the programme or the site, not the drawing. That is a useful answer to have on day two rather than week six.
Common Mistakes to Avoid
Even experienced designers fall into the same few traps.
- Skipping the diagram entirely and going straight to floor plans. This locks in a layout that works geometrically and fails functionally, and by then it is defended by hours of drawing.
- Treating the diagram as a deliverable. It is a working tool: loose, fast and disposable. If a version takes more than half an hour, it has become too detailed for the stage it is at.
- Colour-coding without a legend. A scheme that is obvious to you is opaque to a reviewer, and an unexplained colour is worse than no colour.
- Confusing zones with rooms. A zone is a group with shared requirements, not a space with walls. Drawing them at room scale defeats the point.
FAQ
What is the difference between a zoning diagram and a bubble diagram?
A zoning diagram groups spaces into broad functional categories (public, private, service) and shows how those categories relate. A bubble diagram is a more detailed version where each individual space gets its own proportional bubble, and lines between bubbles indicate specific adjacency requirements. In practice, the zoning diagram comes first to establish the overall organization, and the bubble diagram follows to refine individual room relationships within each zone.
How many zones should a zoning diagram have?
For most building projects, four to six zone categories are sufficient. A typical residential project uses public, private, service, and circulation. A hospital might add clinical, diagnostic, and administrative zones. Using more than seven or eight categories usually means the diagram is trying to do the work of a floor plan, which defeats the purpose of keeping the analysis abstract and readable.
Can I create a zoning diagram digitally or should I hand-draw it?
Both approaches work. Hand sketching is faster for early ideation and allows rapid iteration during design charrettes. Digital tools like Illustrator, Figma, or SketchUp produce cleaner outputs for presentations and portfolio pages. Many students sketch initial versions by hand, then redraw the final version digitally for their presentation boards.
Why is color coding important in zoning diagrams?
Color coding makes the diagram readable at a glance. Without color, a zoning diagram is just a collection of labeled shapes that requires the viewer to read every label before understanding the spatial organization. With consistent colors, the viewer immediately recognizes where public areas, private areas, and service zones sit relative to each other and to the site.
Can I create a zoning diagram without knowing the site?
Yes. A zoning diagram deals with internal programmatic relationships, not site-specific constraints, so you can establish which zones need adjacency and which need separation from the brief alone. When you later overlay it on the site you will rotate and adjust for sunlight, views and access, but the underlying zone logic stays intact.












Leave a comment