


Table of Contents Show
A figure ground diagram is a two-dimensional map that shows built space as solid black and open space as white, so the pattern of streets, squares and blocks becomes readable at a glance. Architects use it to study urban grain, density and the shape of public space before they design anything on a site.
The drawing looks simple, and that is the point. Strip away color, labels, trees and cars, and a city is reduced to a pattern of solid and void. Once you can read that pattern, you can see whether a neighborhood is made of continuous street walls or free-standing objects, where the public spaces are, and how a new building would change them. This guide covers what the drawing is, where it comes from, how the Nolli map changed it, and a practical way to make your own figure ground map from open data.
What Is a Figure Ground Diagram?
The Wikipedia entry on the figure-ground diagram defines it as a two-dimensional map of an urban space that shows the relationship between built and unbuilt space. Buildings become the “figure”, usually filled black, and everything else becomes the “ground”, left white. The black shapes are often called poché, the same word architects use for the solid fill of walls in a plan cut.
The terms come from perception psychology. The Danish psychologist Edgar Rubin developed his well-known vase illusion around 1915, in which the same contour reads either as a vase or as two faces, depending on which area the eye treats as the figure. The urban diagram works on the same principle: you can read the black buildings as objects, or you can read the white spaces as shaped rooms. Good urban design, in the figure ground architecture tradition, cares about both readings.
The reverse convention also exists. The British planner Frederick Gibberd argued for showing buildings in white and spaces in black, to push the designer’s attention onto the space itself. Both versions show the same information; they just change which part your eye treats as the subject.
What a Figure Ground Map Reveals
- Urban grain. Small, many-sided black shapes indicate fine grain and many owners; large blocks indicate coarse grain.
- Street continuity. Continuous street walls read as crisp white channels; scattered buildings dissolve the street into leftover space.
- Public space shape. Squares that read as clear white figures are usually enclosed on most sides; shapeless white areas tend to be parking or setbacks.
- Density. The ratio of black to white gives a quick visual sense of coverage, which you can later confirm with real numbers from a GIS.
The Nolli Map: Where the Figure Ground Diagram Found Its Voice
The most cited figure ground drawing is Giambattista Nolli’s Pianta Grande di Roma of 1748. According to the Wikipedia article on Nolli, the map was commissioned under Pope Benedict XIV to help establish the boundaries of Rome’s 14 traditional districts, or rioni, and was printed from 12 copper plates. Nolli followed the earlier Bufalini map in shading blocks and buildings as dark poché.
What made the Nolli map different was its decision about interiors. Public enclosed spaces, such as the Pantheon and the colonnades of St. Peter’s Square, are drawn in white as if they were streets and squares. The map therefore does not show solid versus void in a strict physical sense. It shows private versus public: the parts of the city a citizen could walk into.
📌 Did You Know?
The assembled Nolli map measures 1760 x 2085 mm (about 69 x 82 inches). Besides the drawing, it carries 1,320 numbered places cross-referenced to indices by district and by type, plus more than 500 place names written directly on the map, as James Tice of the University of Oregon describes in Journal18.
Tice, together with Erik Steiner and Allan Ceen, launched the Interactive Nolli Map Website at the University of Oregon in 2005, which lets you compare the 1748 plan with the modern city. If you are studying Rome or any dense historic center, spending an hour with it will teach you more about reading a nolli map than any written description.
Figure Ground in Urban Design Theory
The figure ground map became a theoretical tool in the second half of the twentieth century, largely as a critique of modernist planning. The “tower in the park” model promoted in the 1920s by architects such as Le Corbusier produced figure grounds that are mostly white with isolated black objects. By the late 1960s, critics argued that these layouts lost the enclosed streets and squares that older cities had.
Two books shaped how architecture schools use the drawing today. Colin Rowe and Fred Koetter’s Collage City (1978) used paired figure grounds to argue for a balance between buildings as objects and space as a shaped figure. Roger Trancik’s Finding Lost Space: Theories of Urban Design (1986) set out three approaches to urban design: figure-ground theory, linkage theory and place theory. In Trancik’s framework, the figure ground is the first layer of analysis, not the whole story. It shows mass and void, while linkage looks at movement and place looks at cultural and social meaning.
Figure Ground Relationship in Architecture at the Building Scale
The same logic applies inside a single building. A plan with thick walls and carved rooms reads like a small Nolli map, with rooms as white figures and the walls as poché. A plan with thin walls and free-flowing space reads more like the modernist city, where the objects float. Recognizing which one you are drawing helps you decide whether your project should fill a gap in the street wall or stand apart from it, which is a common early move in a parti diagram.
How to Make a Figure Ground Diagram From Open Data
You can trace a figure ground by hand over an aerial photo, and for a small site that is still a good exercise. For anything larger, building footprints from OpenStreetMap save hours. The steps below use free tools.

1. Set the Boundary and the Question
Decide what you are trying to show before you draw. A walking radius around your site, a whole neighborhood, or a comparison between two districts at the same scale each need different boundaries. Comparisons only work if both maps use identical scale and frame size, so fix those first.
2. Download Building Footprints
In OpenStreetMap, building outlines are tagged with the building key, which the OSM wiki describes as marking the outline of a man-made structure with a roof. The Export tab on openstreetmap.org works for small areas but fails if the area is too large; for bigger areas, use the Overpass API or a regional extract from Geofabrik. Inside QGIS, the QuickOSM plugin downloads OSM data through the Overpass API and can also open local OSM or PBF files, so you can query “building” for your boundary without leaving the program.
⚠️ Common Mistake to Avoid
Trusting the downloaded footprints without checking. OSM coverage is volunteer-mapped and varies from street to street; missing buildings show up as white gaps that look like squares. Before you draw conclusions, lay the footprints over an aerial image and fill in anything missing by hand.
3. Clean the Geometry
Merge adjacent footprints that share walls if you want to read blocks rather than individual buildings. Decide how to treat courtyards: an enclosed private courtyard is technically open, but leaving it white can make a solid block read as porous. Delete sheds and small structures that add noise. If you are preparing a site analysis sheet, our guide to using GIS data for urban design covers the wider QGIS workflow, including layers you may want next.
4. Render in Pure Black and White
Fill buildings solid black with no outline, set the background to white, and remove everything else. Add only a north arrow and a graphic scale bar, which stays correct when the sheet is resized. Export as vector (PDF or SVG) so you can refine the result in Illustrator or Rhino.
💡 Pro Tip
Make a second version where your proposed building is added in black and nothing else changes. Placing the before and after maps side by side is the fastest way to show a jury how your massing repairs or breaks the street wall, and it takes minutes once the base map exists.
5. Credit the Data
OpenStreetMap data is released under the Open Database License. The OSM copyright page says you may copy and adapt the data as long as you credit OpenStreetMap and its contributors, and make clear the data is available under that license. A single line in the corner of the drawing covers it.
Variations: Nolli-Style, Inverted and Layered Maps
Once you have the base map, three variations are worth knowing.
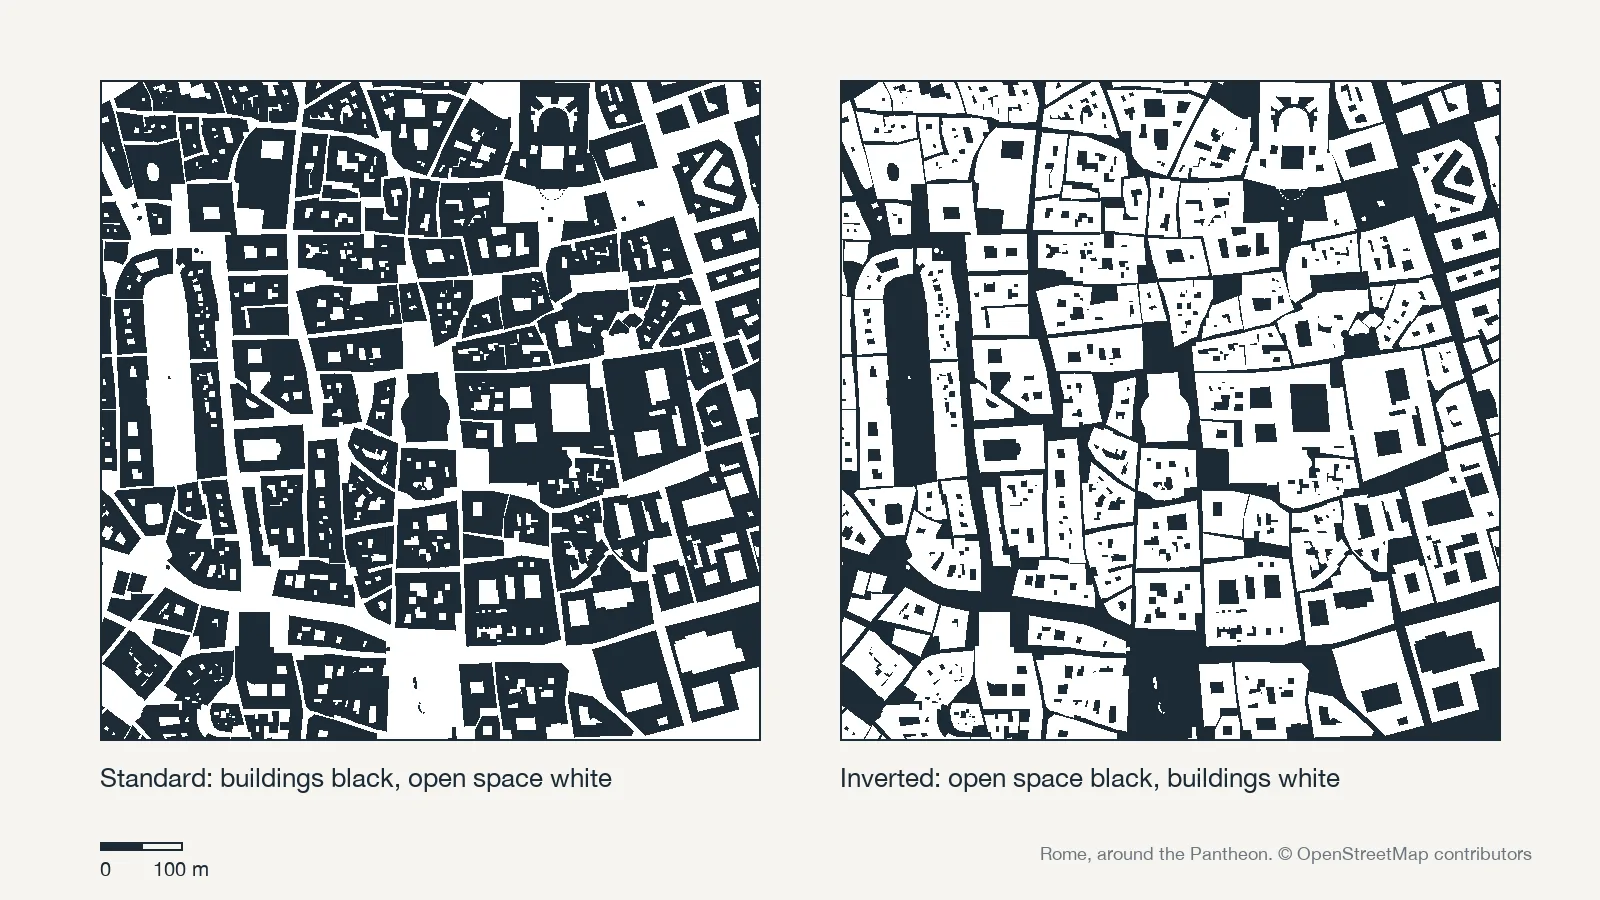
- Nolli-style. Cut public interiors (a church, a covered market, a station concourse, a public atrium) out of the black and render them white, so the map shows where the public can go rather than where the roofs are.
- Inverted. Swap the fills, following Gibberd, to make the street network the subject. This works well for studying street hierarchy.
- Layered. Add one extra tone for green space or water, but keep it to a single layer. The moment you add several colors, the drawing turns into a land use map and loses the solid and void reading.
These variations are especially useful in figure ground urban design studies that compare a historic core with a newer district at the same scale. The contrast between fine and coarse grain usually tells the story without any annotation. For where this drawing sits among the other analytical drawings on a board, see our reference to architectural diagram types, and pair it with a clear architectural site plan so reviewers can move from the city scale to your plot.
The Bigger Picture
A figure ground diagram seems to be about buildings, yet its real subject is the space nobody owns. Nolli understood that when he drew the Pantheon white: the map records what a city gives to the public, and it measures a new project by what it adds to that shared ground, not by the shape of its own roof.











Leave a comment