


Table of Contents Show
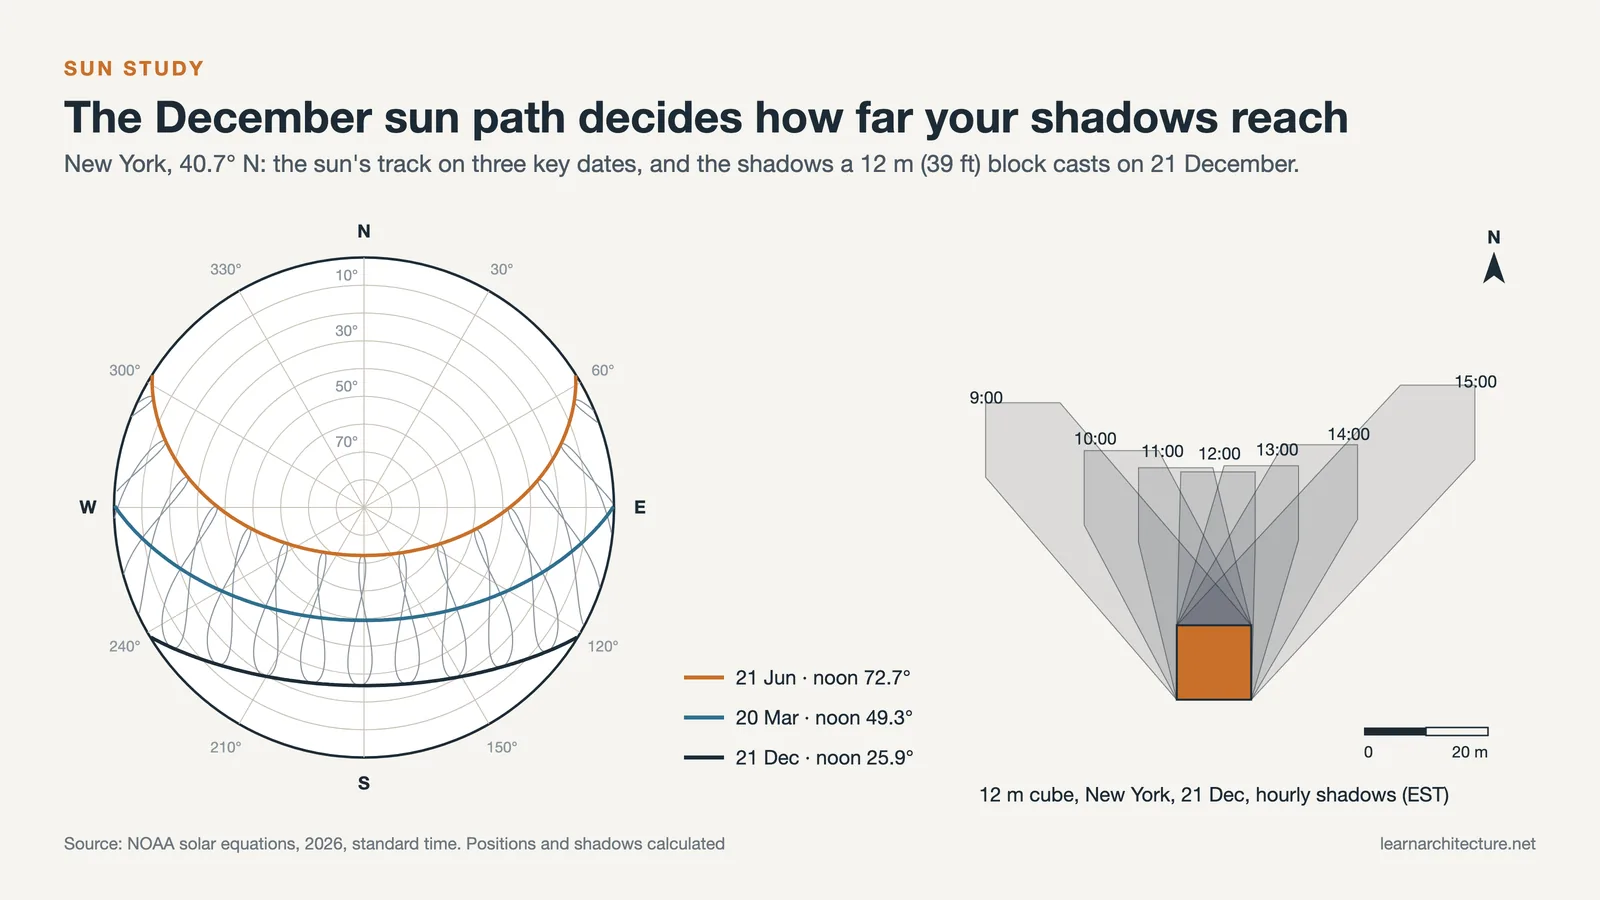
Knowing how to do a sun study comes down to four moves: fix the site’s latitude, longitude and true north, pull the sun’s altitude and azimuth for a handful of key dates, run those angles against a massing model, and draw the resulting shadows at regular intervals. The output is a set of diagrams that shows where light lands and where it does not.
Most students first meet a sun study as a single rendered image with a long shadow and a date in the corner. That image answers almost nothing. A useful study tells you which rooms get direct sun in December, how far your tower’s shadow reaches across the neighbour’s garden, and at what hour a terrace falls into shade. This guide walks through the full method, from coordinates to finished diagrams, and uses real numbers from NOAA’s solar equations so you can check your own work.
What a Sun Study Actually Answers
A sun study tracks the position of the sun relative to a building and its site across the day and across the year. A shadow study is the same exercise read from the other side: instead of asking where the sun is, it maps where the building blocks it. In practice the two are run together, which is why you will see the combined phrase “sun path and shadow analysis” on planning drawings.
The questions a study should settle are specific:
- Which facades receive direct sun, and for how many hours, on the shortest and longest days?
- Where does the new building’s shadow fall on streets, courtyards, parks and neighbouring windows?
- Which outdoor spaces keep sun at the times people actually use them?
- Where do shading devices earn their cost, and where would they only block useful winter gain?
If your diagrams cannot answer at least one of these, the study is decoration. Treat it as part of the site analysis, alongside wind, views and access, rather than as a rendering task done at the end. Our overview of architectural site analysis techniques shows where solar access sits among the other site studies.
What You Need Before You Start
Coordinates, time zone and true north
Every sun angle depends on latitude and longitude, so get them from a survey, a GIS layer or a map pin on the actual plot, not the city centre. You also need the time zone offset from UTC and a decision on whether you are working in standard time or daylight saving time. Finally, you need the angle between true north and your drawing’s up direction, because a site plan rotated to fit the sheet will throw every shadow off by that rotation.
Heights for your building and its neighbours
A sun study is only as accurate as its heights. Include parapets, rooftop plant, stair bulkheads and lift overruns, since these set the tip of the shadow. For neighbouring buildings, a simple extruded block at the correct height is enough. Trees and terrain matter on sloping or wooded sites; a two-storey house on a south-facing slope behaves very differently from the same house on flat ground.
A short list of dates and hours
You do not need 365 days. The standard set covers the two solstices and one equinox, and many practices add a spring or late-summer date between them. For 2026, the US Naval Observatory’s seasons data puts the March equinox on 20 March at 14:46 UT, the June solstice on 21 June at 08:24 UT and the December solstice on 21 December at 20:50 UT. Because the sun’s declination changes very slowly around those dates, a study run on 21 December is valid for the solstice week.
⚠️ Common Mistake to Avoid
Setting shadows by compass north instead of true north. A phone compass or a survey drawn to magnetic north can differ from true north by several degrees depending on where and when it was taken, and that error rotates every shadow on the page. Check the local declination with NOAA’s magnetic field calculator, or better, take north from a geo-referenced survey or GIS base map.
How to Do a Sun Study in 7 Steps
The steps below follow the order most architects work in, whether the model lives in SketchUp, Revit, Rhino or on paper. Each step produces something you can check before moving on.
Step 1: Fix the location in your model
Enter latitude, longitude and time zone, then rotate the model so its north matches true north. In SketchUp, the Shadows panel only works after you geolocate the model with Add Location, and its calculations use the model’s latitude and longitude, its cardinal orientation and the selected time zone. Revit and Rhino have equivalent location settings. Write the coordinates and north angle in the corner of every diagram you produce so a reviewer can reproduce them.
Step 2: Pull sun angles from an official calculator
Before trusting any software, get independent numbers. The NOAA Solar Calculator takes a location, time zone, date and local time and returns solar azimuth and elevation, apparent sunrise and sunset, solar noon, the equation of time and solar declination. NOAA states that its sunrise and sunset results are theoretically accurate to within a minute between 72 degrees north and south, and that the calculations come from Jean Meeus’s Astronomical Algorithms. It also carries a notice that the tool is no longer actively maintained, so treat it as a cross-check, not a sole source. Record solar noon and sunrise for each test date; you will use them to set your time window.
Step 3: Read the sun path diagram
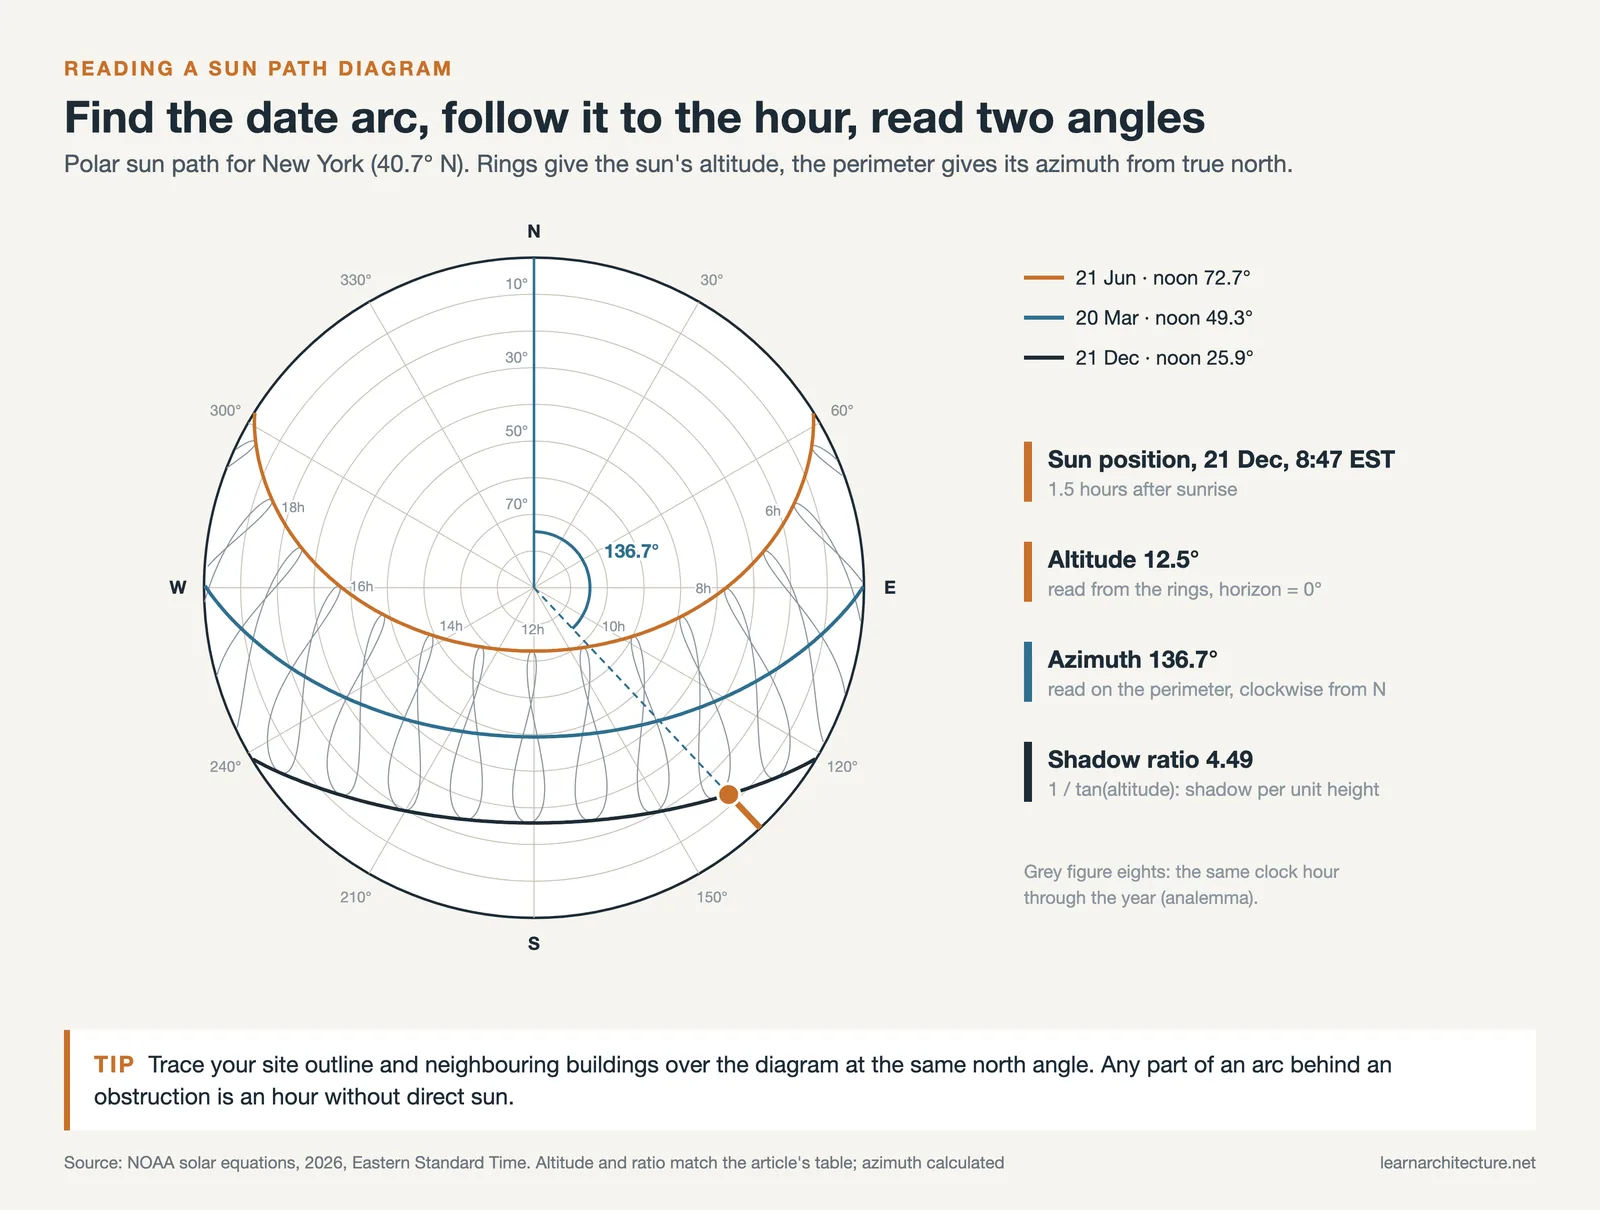
A sun path diagram plots the sun’s track across the sky for a given latitude. In the polar version, the outer ring is the horizon, concentric rings mark altitude, radial lines mark azimuth and each curved arc is one date. Hour lines cross the arcs, often forming a figure-eight analemma. To read a position, find the date arc, follow it to the hour line and read altitude from the rings and azimuth from the perimeter. Sketch your site outline and neighbouring obstructions over the diagram and you can see at a glance which hours are blocked.
For a printable chart, the University of Oregon’s Solar Radiation Monitoring Lab runs a free sun path chart program that draws Cartesian or polar charts for the 21st of every month, a single date or a custom range. Our list of sun path and shadow study apps covers phone tools that overlay the same arcs on a camera view, which is handy on a site visit.
Step 4: Build a massing model at the right level of detail
Model the proposal and its neighbours as simple volumes. Detail beyond that rarely changes the result, and it slows every shadow run. Two things do need care: the true highest point of each building and the ground plane. If the site slopes, model the terrain, because shadows stretch downhill and shorten uphill.
💡 Pro Tip
Run one test before the real study: pick a date and time, read the sun’s elevation from the NOAA calculator, then measure a shadow in your model and divide the building height by the shadow length. The result should equal the tangent of that elevation. If it does not, your location, time zone or daylight saving setting is wrong, and it is far cheaper to find out now than after thirty diagrams.
Step 5: Run shadows at fixed intervals
Pick an interval and keep it constant for every date. Hourly frames are the norm for design work; half-hourly frames help where a courtyard or window is borderline. Run from a set time after sunrise to the same time before sunset, because near the horizon shadows become extremely long and blend into existing shade. Export each frame from the same camera, a top-down plan view for shadow analysis and an axonometric for presentations.
Step 6: Measure shadow length and direction
A shadow on flat ground points directly away from the sun, so its direction is the solar azimuth plus 180 degrees. Its length follows from basic trigonometry.
📐 Technical Note
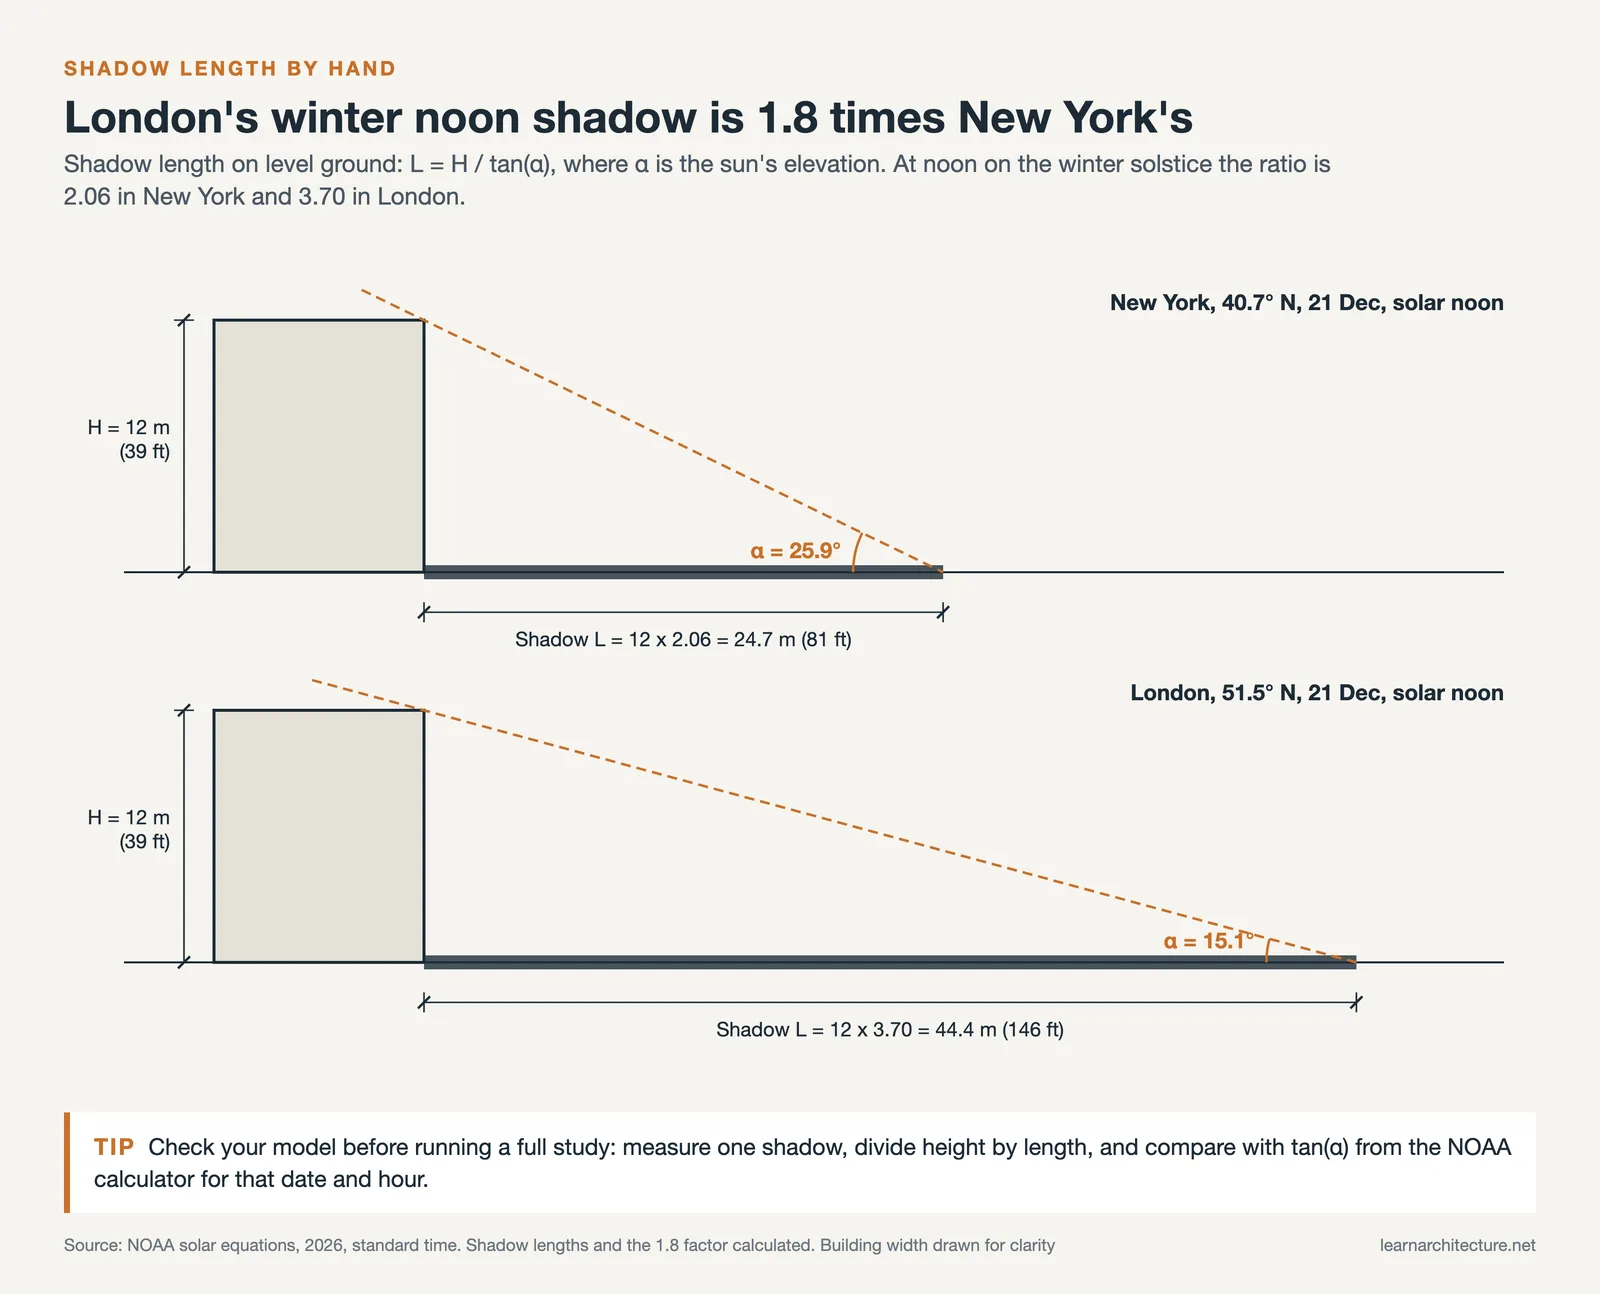
Shadow length on level ground = object height ÷ tan(solar elevation). The factor 1 ÷ tan(elevation) is the shadow ratio: the length of shadow cast per unit of height. At 45 degrees the ratio is 1.0; at 25.9 degrees it is about 2.06; at 12.5 degrees it is about 4.5. Elevation here is the refraction-corrected value the NOAA calculator reports.
Once you have the ratio, you can check any point by hand. A 12 m (39 ft) building at a shadow ratio of 2.06 casts a shadow about 24.7 m (81 ft) long. On sloping ground, measure along the slope in the model rather than applying the formula.
Step 7: Draw and present the results
Clear sun study drawings share a few habits. Each sheet shows one date, with each hour’s shadow drawn as a separate tone or outline, a true north arrow, a scale bar and the time basis stated (for example “Eastern Standard Time”). Existing shadow and new shadow should be visually distinct, since the question a reviewer asks is what the proposal adds. For hours of direct sun on a facade or a garden, a false-colour map from an analysis plugin reads faster than a stack of frames. Our guide to architectural diagram types and conventions covers line weights and legends that keep these sheets consistent with the rest of a set.
A Worked Sun Path and Shadow Analysis: New York vs London
The table below was calculated with NOAA’s published solar equations for two latitudes, using standard time (no daylight saving) and 2026 dates. It shows the sun’s elevation at solar noon, the shadow ratio at that moment, and the same values 1.5 hours after sunrise. You can reproduce any row by entering the same date and time in the NOAA calculator.
Sun angles and shadow ratios for key dates
| Location and date | Noon elevation | Noon shadow ratio | Elevation 1.5 h after sunrise | Shadow ratio then |
|---|---|---|---|---|
| New York (40.7° N), 21 Dec | 25.9° | 2.06 | 12.5° | 4.49 |
| New York, 20 Mar | 49.3° | 0.86 | 16.1° | 3.48 |
| New York, 21 Jun | 72.7° | 0.31 | 14.6° | 3.84 |
| London (51.5° N), 21 Dec | 15.1° | 3.70 | 8.7° | 6.53 |
| London, 20 Mar | 38.5° | 1.26 | 13.0° | 4.34 |
| London, 21 Jun | 61.9° | 0.53 | 11.0° | 5.13 |
Two lessons fall out of these numbers. First, latitude matters more than most people expect: at noon on the winter solstice, the same 12 m (39 ft) building casts a shadow of about 24.7 m (81 ft) in New York and about 44.4 m (146 ft) in London. Second, the noon shadow in June is short in both cities, which is why a study run only in summer makes almost any proposal look harmless. The December frames are where neighbours lose light.
Latitude also explains why passive solar strategies change from city to city. A low December sun reaches deep into a south-facing room, which is the principle behind a Trombe wall and other passive solar design, while the high June sun can be blocked by a modest overhang.
How Planning Authorities Frame a Shadow Study
If your project needs approval, the authority’s method overrides your own preferences. New York City’s CEQR Technical Manual, Chapter 8 (December 2025 edition) is one of the clearest published examples, and its logic transfers well to other cities.
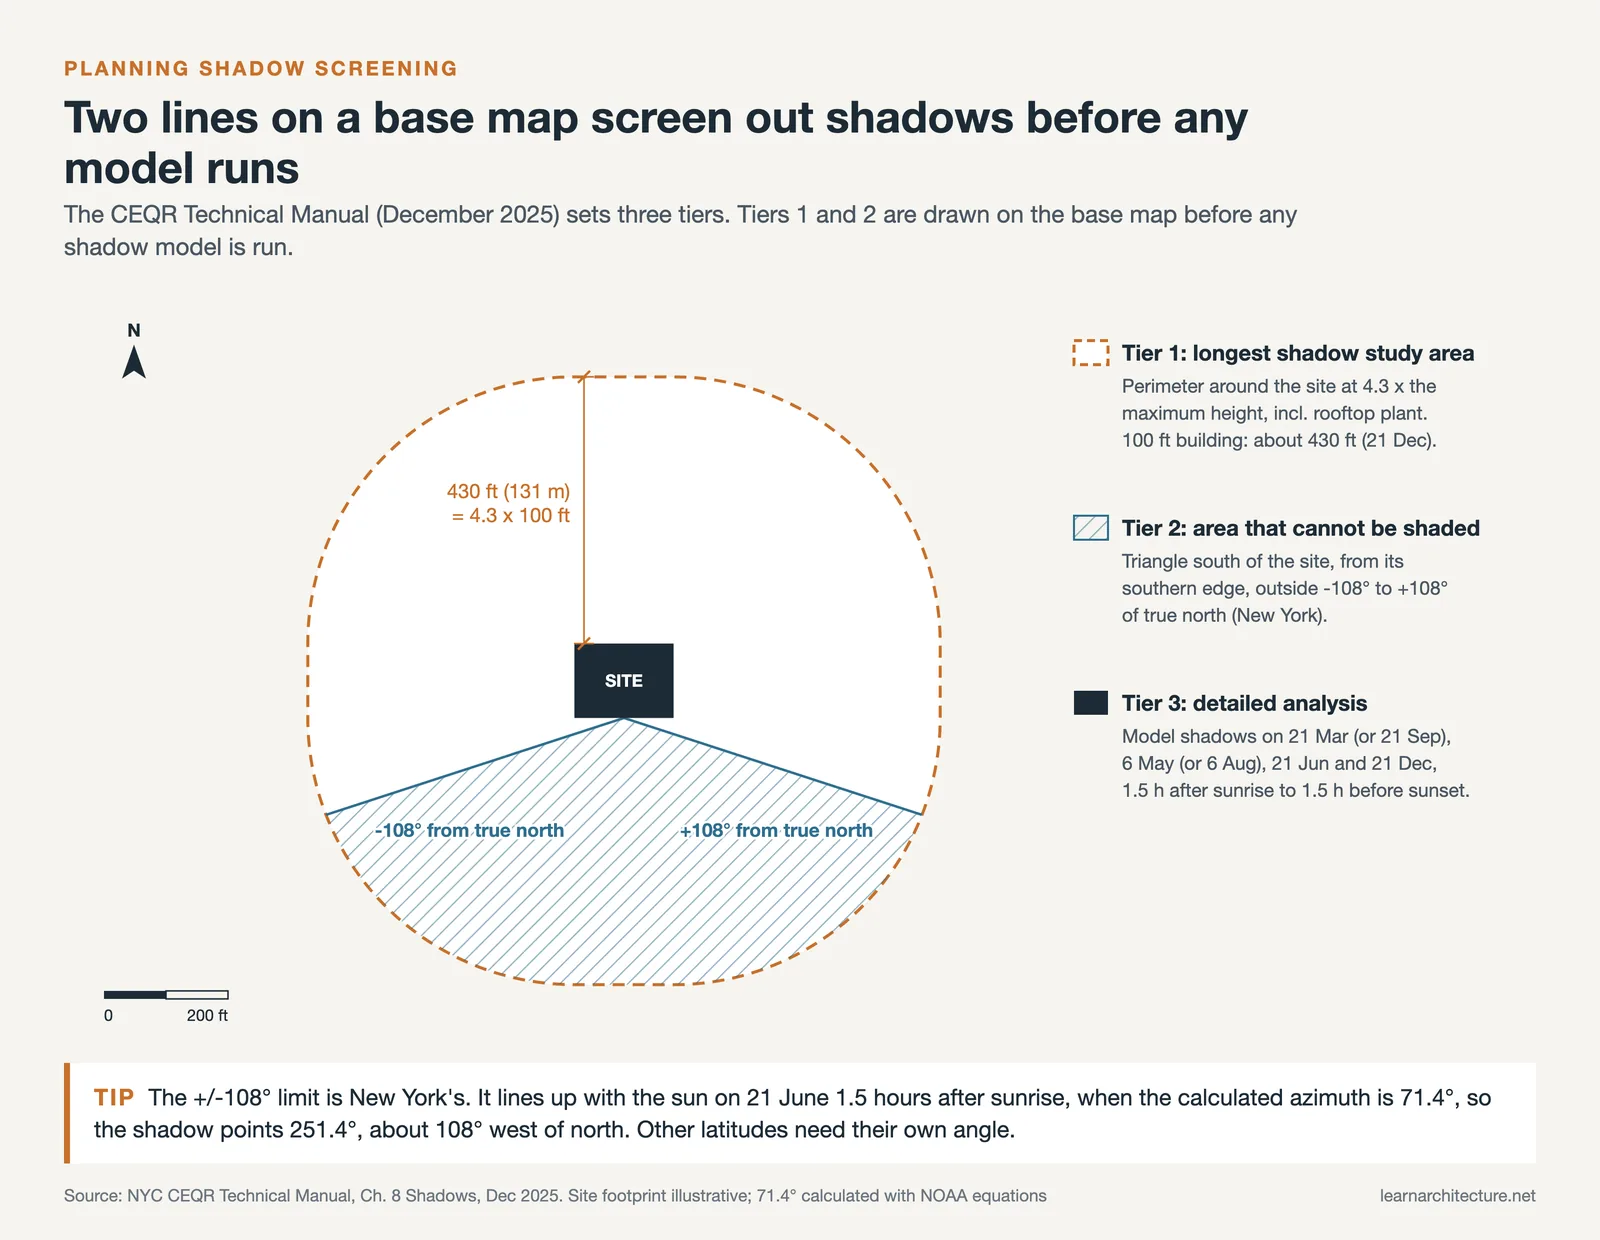
- Tier 1: draw a circle around the site with a radius of 4.3 times the building’s maximum height, including rooftop equipment and parapets. The manual gives the example of a 100 ft (30.5 m) building with a longest shadow of about 430 ft (131 m) on 21 December. Sunlight-sensitive resources outside that circle are screened out.
- Tier 2: in New York, no shadow can fall in the area between 108 degrees either side of true north measured from the southern edge of the site, so resources there are screened out too.
- Tier 3: model the building and run shadows on four representative days: 21 March (or 21 September), 6 May (or 6 August), 21 June and 21 December.
The manual limits the analysis window to 1.5 hours after sunrise until 1.5 hours before sunset, and it specifies standard time rather than daylight saving time. Those two rules alone prevent most arguments over a submitted study. Note how the New York figure of 4.49 in the table above, calculated for 1.5 hours after sunrise on 21 December, sits close to the manual’s 4.3 factor; small differences come from exact start times and rounding.
Shadow and daylight rules differ by jurisdiction. Always confirm the required dates, hours and methods with the local planning authority before starting a study for submission.
Tools for Sun Path and Shadow Analysis
Almost any 3D package can cast shadows. The choice depends on what you need to report.
- SketchUp handles geolocated shadow frames quickly and is often enough for early design and planning diagrams.
- Revit includes a sun path display and solar study settings, useful when the shadow study must match the BIM model issued for approval.
- Rhino with Ladybug Tools goes further. The Ladybug SunPath component draws a sun path into the Rhino scene and outputs sun vectors for solar access analysis and shading design, with inputs for location, north offset, hours of the year and an optional daylight saving period.
For hours-of-sunlight maps and daylight metrics beyond simple shadows, see our comparison of daylight analysis software. Whatever tool you use, the NOAA cross-check from Step 2 still applies.
📌 Did You Know?
The solstice is a precise moment, not a whole day. The US Naval Observatory lists the December 2026 solstice at 20:50 UT on 21 December, which is already 22 December in Tokyo or Sydney. For shadow work the difference is negligible, because the sun’s declination barely moves in the days around a solstice.
What This Means for Your Next Project
Knowing how to do a sun study pays off when you run it early, on the right dates, with a model you have checked against independent numbers. Winter frames show the worst case for neighbours, equinox frames show the typical case, and summer frames show where you need shading rather than more glass.
Your Next Step: Open the NOAA Solar Calculator, enter your current site’s coordinates, and write down the solar noon elevation for 21 December and 21 June. Divide 1 by the tangent of each angle, and you already know how far your building’s shadow reaches at noon at both ends of the year.
Frequently Asked Questions
What dates should a sun study include?
At minimum, the December and June solstices and one equinox. New York’s CEQR manual adds a mid-season day (6 May or 6 August) between the June solstice and the equinoxes. For southern hemisphere sites, the seasons are reversed, so 21 June is the winter case.
What is the difference between a sun study and a shadow study?
A sun study tracks where the sun is relative to the building and which surfaces it reaches. A shadow study maps where the building blocks that sun on its surroundings. Most submissions combine both as a sun path and shadow analysis.
Should a sun study use daylight saving time?
Either can work for design, but state which one you used on every sheet. NYC’s CEQR manual requires standard time for shadow assessments, and many other authorities set their own rule, so check before you run the frames.
How do I calculate shadow length by hand?
Divide the height of the object by the tangent of the sun’s elevation angle. Take the elevation from the NOAA Solar Calculator for the date and time you are testing; the result is the shadow length on level ground.












Leave a comment