


Table of Contents Show
A street section is a drawing that cuts across a street from building face to building face and shows every band in between: travel lanes, parking, bike lanes, medians, planting and sidewalks, each with its width. It is the drawing planners and engineers use to decide how a right-of-way is shared.
Plans show where a street goes. The cross section shows what it is made of, and that is where most arguments about a street are settled, because every extra foot given to a parking lane is a foot taken from a sidewalk or a bike lane. Below you will find the widths the main US guides actually publish, a step-by-step method for drawing a section by hand or in software, and five real examples, from Haussmann’s Paris to a Streetmix drawing of Queens Boulevard, with what each one gets right and where the numbers stop adding up.
What Is a Street Section?
In urban design, a street cross section is a vertical cut taken at right angles to the street. It runs across the full right-of-way, usually from property line to property line, and often continues to the building faces so that the height of the street wall can be read against its width. Each surface is drawn as a band with a dimension under it, and the bands add up to one total. Our guide on how to read plans, sections and elevations covers the general logic of a cut; the street version applies the same logic to the public realm instead of a building.
The term has a second meaning in building design, and the two are often confused. Architects also call a building section drawn parallel to a street a “street section”, because it shows the building as seen from that street. The drawing below for a music school in Philadelphia is a good example: it is labelled Moravian Street Section A and drawn at 1/4 inch to the foot, but it cuts through the building’s halls and floors, not through traffic lanes.
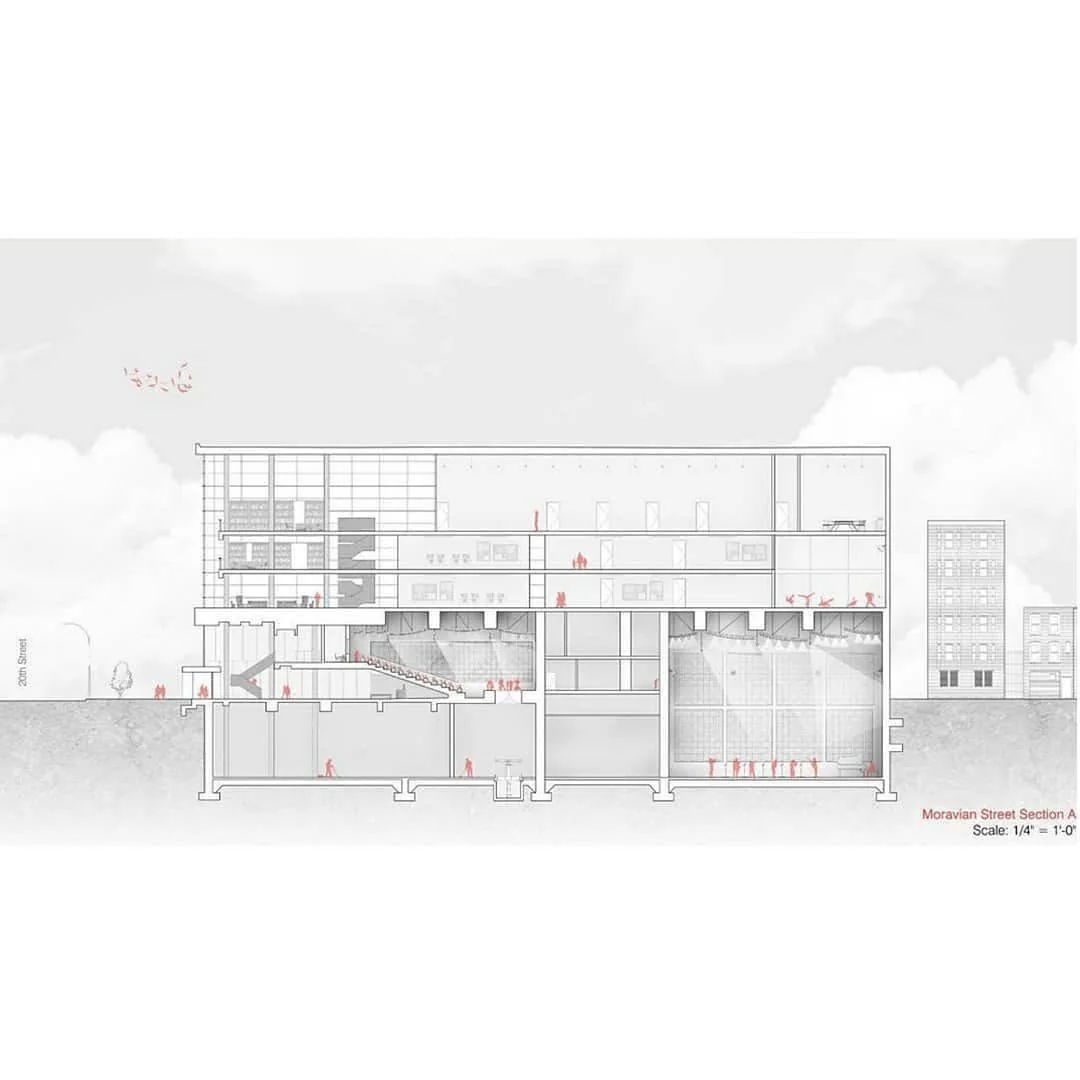
Both drawings are useful, but they answer different questions. A building section along a street asks how the interior meets the sidewalk. A street cross section asks how the space between two building lines is divided among people walking, cycling, parking and driving.
⚠️ Common Mistake to Avoid
Students often submit a building section cut along a street when a brief asks for a street section. If the brief is about streetscape design, the cut must cross the street itself, curb to curb and beyond, and every lane must carry a width. A section that shows the building interior in detail and the roadway as a single grey line answers the wrong question.
Street and Road Cross Section Components and Typical Widths
Most US street cross sections are built from the same six components. The widths below come from published guidance, and the table gives them in feet with metric equivalents. Treat them as ranges to test, not values to copy, because each city adopts its own standards.
Typical Widths at a Glance
| Component | Published width | Source |
|---|---|---|
| Travel lane | 9 to 12 ft (2.7 to 3.7 m); 10 ft allowed at 45 mi/h or less | AASHTO Green Book, via FHWA |
| Urban arterial lane | 10 to 12 ft (3.0 to 3.7 m) | AASHTO Green Book, via FHWA |
| Parking lane | 8 ft absolute minimum, 10 ft desirable (2.4 to 3.0 m) | City of Los Angeles |
| Bike lane at curb | 6 ft desirable (1.8 m) | NACTO |
| Bike lane next to parking | At least 5 ft (1.5 m) | NACTO |
| Median used as refuge | At least 6 ft (1.8 m) | AASHTO Green Book, via FHWA |
| Border with street trees | At least 9 ft (2.7 m) | City of Los Angeles |
Travel Lanes
The AASHTO Green Book allows travel lanes between 9 and 12 feet depending on speed, capacity and context, and it permits 10-foot lanes where speeds are 45 mi/h or less, according to the FHWA design topic on design criteria and lane width. The same FHWA document quotes the NACTO Urban Street Design Guide on the point: lane widths of 10 feet are appropriate in urban areas without hurting traffic operations. FHWA also cites a 2007 study by Potts, Harwood and Richard that found 10 to 11 foot lanes on urban and suburban arterials had no measurable effect on capacity, with one exception: 10-foot lanes should be used with caution on 4-lane undivided arterials.
The reason this matters on a drawing is simple arithmetic. On a street with four travel lanes, dropping from 12 to 10 feet frees 8 feet, which is enough for a bike lane on one side or a wider sidewalk on both.
Parking Lanes
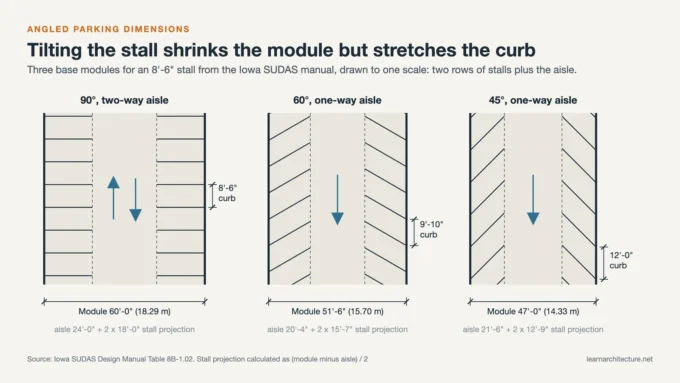
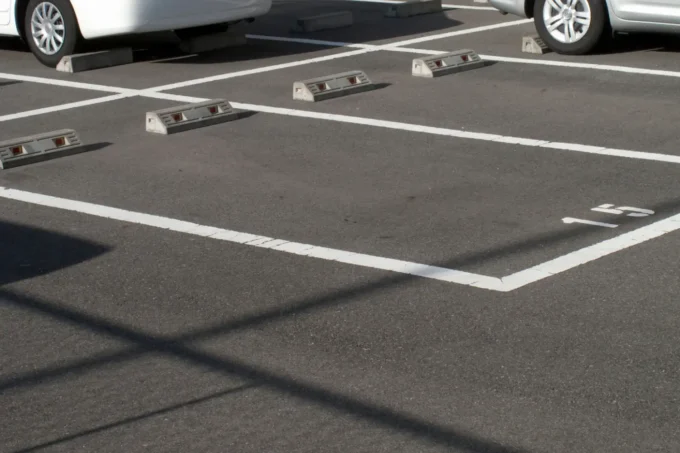
Parking lanes are where local standards differ most. The City of Los Angeles street design manual sets an absolute minimum parking lane of 8 feet and a desirable minimum of 10 feet, and for travel lanes it lists 9 feet as the absolute minimum, 10 feet as the desirable minimum, 11 feet as standard and 12 feet as the maximum. If your section includes angled or perpendicular parking instead of parallel parking, the band gets much deeper; our reference on standard parking space dimensions gives the stall and aisle sizes.
Bike Lanes
The NACTO Urban Bikeway Design Guide gives a desirable width of 6 feet for a bike lane against a curb face, and requires a bike lane next to a parking lane to be at least 5 feet wide unless a marked buffer separates them. It also measures the whole band: from the curb face to the outer edge of the bike lane, including parking and buffer, the desirable reach is 14.5 feet and the absolute minimum is 12 feet. Drawing the parking lane and bike lane as one dimensioned group makes that reach visible, which is the number that decides whether a cyclist rides inside the door zone of parked cars.
Sidewalk Zones and Planting Strips
On a section, the sidewalk is not one band but several: a frontage zone along the buildings, a clear pedestrian through zone, and a street furniture zone at the curb, terms FHWA takes from the NACTO guide. Sidewalk width standards deserve their own article, so here it is enough to draw the zones separately. Street trees need real space: the Los Angeles manual requires a minimum border width of 9 feet where trees and tree wells are installed in the parkway.
Medians
A median earns its width when people stand on it. FHWA’s design topic on intersection geometry cites the AASHTO Green Book: a median that serves as a pedestrian refuge should be at least 6 feet wide, and crossings of four or more lanes should provide one. Los Angeles uses a standard median of 14 feet on major streets and warns that a median nose narrower than 4 feet will not protect pedestrians or signal poles.
Lane, parking and median widths vary by jurisdiction and by road classification. Always check the adopted street design manual of the city you are drawing for, and have dimensions for a real project confirmed by a licensed engineer.
How to Draw a Street Section Step by Step
The method below works the same way on tracing paper, in CAD or in a browser tool. The order matters more than the medium: fix the cut and the total first, then divide it.
Step 1: Choose Where to Cut and Which Way to Look
Mark the cut line on a plan at a typical point of the block, away from intersections where turn lanes change the layout. Add arrows that show the viewing direction, and label the cut (A-A, B-B) so the plan and section can be read together. If the street changes along its length, you need more than one cut; the Beacon Street example below uses two.
Step 2: Set the Right-of-Way and the Scale
Write down the total width between property lines before drawing anything, then pick a scale that fits it on the sheet with room for labels. Our article on architectural drawing scales explains how to choose one. A wide boulevard needs a small scale; a residential lane can be drawn large enough to show curb details.
📐 Technical Note
Older drawings often state scale as a ratio of lengths. Alphand’s profile of the Avenue de l’Impératrice is marked “Échelle de 0.002”, which means 0.002 m on paper per metre on the ground, or 1:500. At that scale the 120 m avenue fits in a 24 cm strip.
Step 3: Draw the Ground Line, Curbs and Cross Slope
Draw the finished surface as a heavy line, then add curbs, gutters and the edges of each paved surface. Roads are not flat in section: their cross slope carries water away from the crown or centerline to the gutter. The typical section sheet below, drafted in MicroStation as a teaching example, labels a 0.02 ft/ft slope (2 percent) on the travel lanes and 0.015 ft/ft on the sidewalk and path, with curb and gutter, subgrade and existing ground all named.

Use a clear hierarchy of line weights so the cut surfaces read first and the background second; our guide to architectural line weights covers the conventions. Engineers also draw a centerline symbol at the axis, which gives every dimension a reference point.
Step 4: Build the Dimension String
Under the section, run one continuous chain of dimensions, one per band, and a second, longer dimension for the total right-of-way. Check that the chain adds up to the total before you add anything else. Our article on dimensioning architectural drawings explains where to place strings so builders can trust them.
💡 Pro Tip
Dimension lanes to the curb face, not to the back of curb or the lane stripe, unless the local manual says otherwise. Mixing reference points is a frequent reason a drawing looks correct but loses a foot or two when the engineer rebuilds it.
Step 5: Add Trees, People and Building Edges
Trees, people, cyclists and vehicles turn a diagram of widths into a picture of a street. Draw them to scale, because a 6-foot bike lane only reads as 6 feet when a cyclist of real size rides in it; see our notes on scale figures and entourage. Add the lower floors of the buildings on each side so the ratio of street width to building height is visible. This is the step where a section starts to talk about streetscape design, not only traffic.
Step 6: Label the Bands and Pair the Section with a Plan
Name every band under its dimension (sidewalk, parking, bike lane, buffer, travel lane, median) and keep the labels in one row. Then draw a short strip of plan directly above or below at the same scale, so the reader can see what happens between cuts: tree spacing, driveways, crossings. A section-perspective, like the Moratalaz drawings further down, goes one step further and shows depth.
Hand Drawing vs Streetmix and CAD
A quick hand sketch is still the fastest way to test a layout. The watercolour sketch below fits five bands into one line of dimensions, 2, 4, 1.5, 4 and 2 metres, with bamboo planting in the 1.5 m centre, and is enough to discuss a design before any software is opened. Our comparison of digital and hand drawing covers when each one makes sense.

For drawings you will share, browser tools save time. Streetmix lets you drag segments into a street and edit each width; according to its project README on GitHub, it began as a Code for America hackathon project in January 2013, and Streetsblog traced the idea to a community meeting about the redesign of Second Street in San Francisco. For 3D work, Esri added a Street Designer to ArcGIS CityEngine with tools to add, remove and widen lanes. Civil engineers still produce the final typical section in CAD, and if you want a rendered version for a board, our tutorial on rendering sections in Photoshop takes a line drawing from there.
💡 Pro Tip
Before redesigning a street, draw the existing section first and get its total right. Presenting an existing and a proposed section side by side, with the same total width, is the clearest way to show a client or a community meeting what is being traded.
Real Street Cross Section Examples
The five examples below are real streets drawn by real offices, engineers and designers. Each one shows a different use of the drawing, and two of them show where the numbers on paper and the street on the ground part ways.
Avenue Foch (1854) – Paris, France
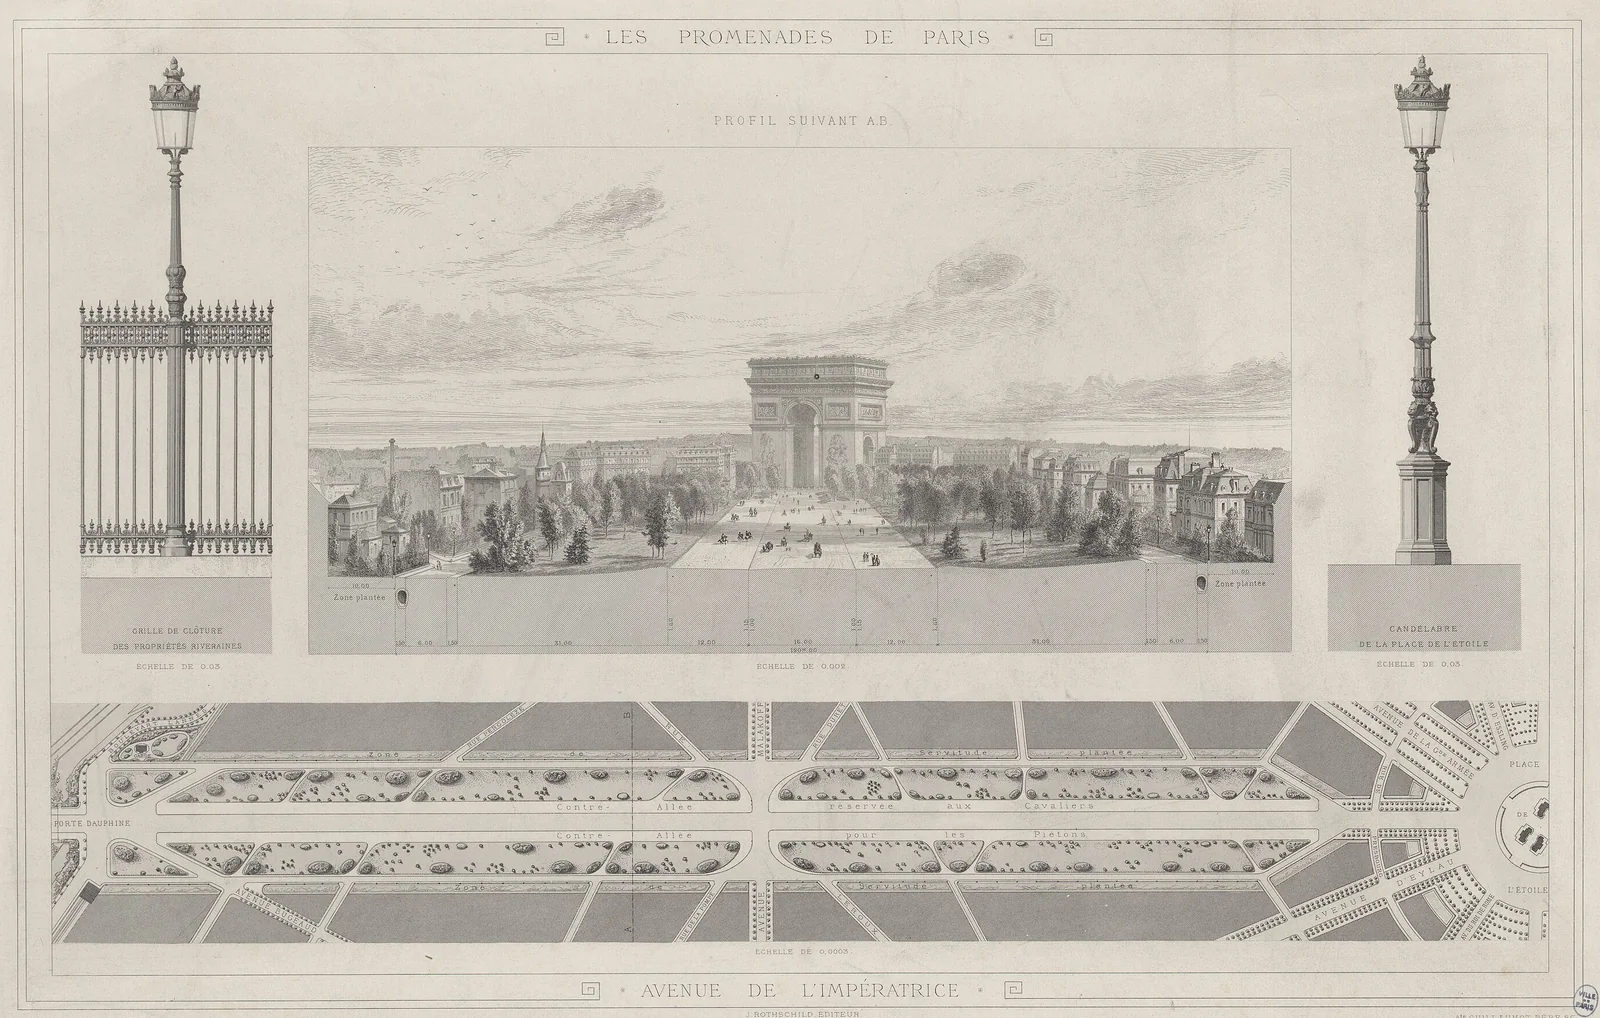
Opened in 1854 as the Avenue de l’Impératrice, the avenue was built by Jean-Charles Adolphe Alphand, chief engineer of the city’s promenades service. According to the Avenue Foch entry on Wikipedia, Jacques Hittorff’s original plan called for an avenue 40 metres wide, and Baron Haussmann replaced it with one at least 100 metres wide; the final design was 120 metres wide and 1,300 metres long. The plate from Alphand’s Les Promenades de Paris, held by the Musée Carnavalet, shows the profile and plan on one sheet.
The dimension string under the profile adds up exactly: 1.50, 6.00 and 1.50 on each edge, two 31.00 m planted bands, two 12.00 m bands and a 16.00 m centre, for a total marked 120.00 m. Beyond the property lines, a 10.00 m “zone plantée” of front gardens is dimensioned separately. The two 31 m bands alone take more than half the width, which explains why the avenue reads as a park with a road through it rather than a road with trees.
Beacon Street (1887) – Brookline, USA
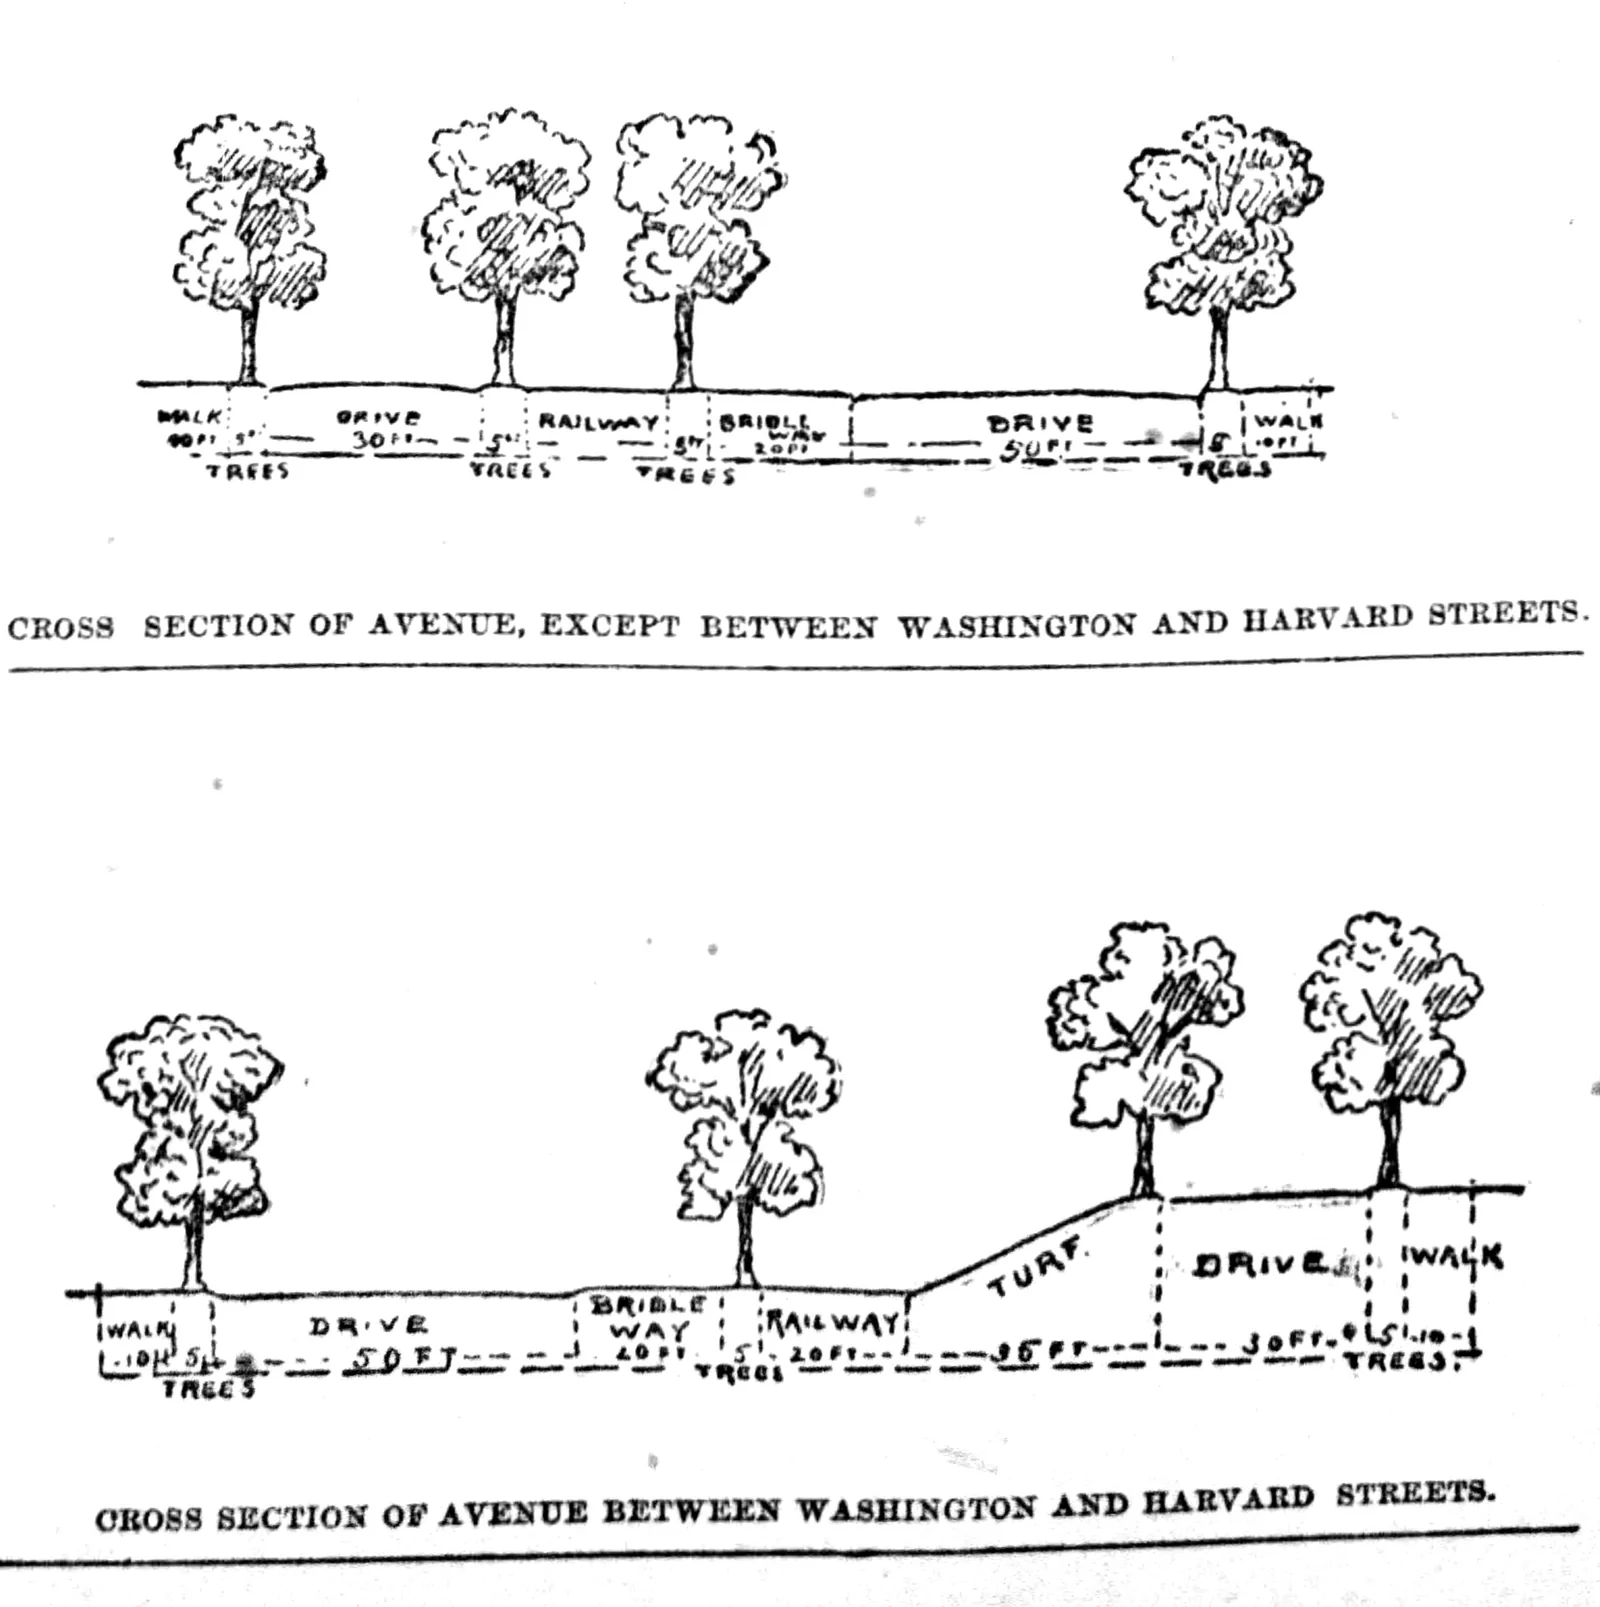
The Brookline Historical Society records that Frederick Law Olmsted and John C. Olmsted designed the widening in 1886 for Henry Whitney’s West End Land Company. The first scheme was 200 feet wide, with two bridle paths, a commercial lane, a pleasure drive, a lane for cycling or walking and streetcar tracks. After local opposition, Whitney paid $150,000 of his own money and agreed to reduce the widening to 160 feet, dropping one bridle path and the cycle path. Construction began in April 1887.
The two sections published in the Boston Globe that May show the result as a set of named bands: 10-foot walks, a 30-foot drive, a 20-foot bridle way, a 50-foot drive and 5-foot tree strips between them, with the railway in its own reservation. The second section, for the stretch between Washington and Harvard Streets, adds a 35-foot turf slope where the ground rises. Two cuts were needed because one would have hidden the change in level.
📌 Did You Know?
The “railway” band in the Beacon Street section became the second electric trolley line in the United States, and according to the Brookline Historical Society it is the oldest still in continuous operation. Whitney had planned horsecars or cable cars until he saw Sprague’s electric system in Richmond, so the band drawn in 1887 outlived the technology it was first drawn for.
Queens Boulevard – New York, USA

Queens Boulevard is 200 feet wide for much of its length, and much of the road has 12 lanes; its record of crashes earned it the name “Boulevard of Death”. The Streetmix section above, drawn near 73rd Street, shows the layout after the city’s safety redesign, which added bike lanes between Roosevelt Avenue and 73rd Street in 2015: 6-foot sidewalks, 9-foot parking lanes, 11-foot drive lanes, 5-foot bike lanes with 4-foot buffers, 6-foot malls, and a central roadway of 10-foot lanes split by a 4-foot median.
Add the labels up and the drawing totals 160 feet, while the boulevard between Van Dam Street and Union Turnpike is listed at 200 feet. The section is still useful, because it shows the order and relative size of every band, but it is a diagram of the roadway, not a surveyed section, so read its widths as indicative.
Massachusetts Avenue – Boston, USA
This example has no drawing here, but it shows a section changing a project. FHWA’s lane width case study describes the reconstruction of Massachusetts Avenue by the City of Boston and MassDOT: an arterial carrying 33,000 vehicles per day and the bus route with the highest ridership in the region. The $18 million bid package did not include bike facilities. Boston used the design exception process to narrow the travel lanes, and a change order produced a new cross section of 10.5-foot travel lanes and 5-foot bike lanes. The only thing that changed on paper was the dimension string.
Moratalaz Streets (2024) – Madrid, Spain

Víctor Ortega López, who posts as vo.paisajismo, drew a series of 3D sections of streets in Moratalaz, a district of Madrid, for analysis. The cut is taken through the street and the buildings on both sides, and the drawing is shown in perspective so the reader sees a short length of street behind the cut. Each label points to a design move in Spanish: mixed use at ground floor, individual tree pits, pedestrian crossings, planted separating elements, wide sidewalks reserved for walking, and green space in the squares between buildings.
This is the format to use when a section has to explain relationships, not dimensions. It carries no widths at all, so it cannot be checked or built from, but it shows how the parked cars, trees and green squares sit together far better than a flat cut would.
Common Cross Section Mistakes
The bands do not add up to the right-of-way
The Queens Boulevard drawing shows how easily a section can lose 40 feet. Always write the total first and check the chain against it, as the Alphand plate does to the centimetre.
The cut is taken at the wrong place
A section at an intersection shows turn lanes; a section mid-block shows parking. If the street changes, draw two cuts, as the Beacon Street sections do.
The ground is drawn flat
Without cross slope, curbs and gutters, a road cross section cannot show drainage, which is why civil sheets like the MicroStation example label every slope.
No people, no buildings
Widths without figures or building edges hide the experience of the street. The Moratalaz drawings show how much a few figures and facades add.
Frequently Asked Questions
What is the difference between a street section and a street plan?
A plan is a view from above that shows where things are along the street. A section is a vertical cut across it that shows the width and level of each band, such as lanes, parking and sidewalks. The two are drawn at the same scale and read together.
How wide is a standard traffic lane?
The AASHTO Green Book allows 9 to 12 feet, and it permits 10-foot lanes at speeds of 45 mi/h or less. NACTO treats 10 feet as appropriate in urban areas, and cities such as Los Angeles set their own minimum, standard and maximum values.
What is a road cross section in civil engineering?
It is usually called a typical section: a dimensioned cut showing lanes, shoulders or curbs, cross slopes, pavement layers and subgrade. Engineers draw it in CAD with a centerline reference, and the same sheet often shows several typical sections for different stretches of the road.
What is the best free tool to draw a street cross section?
Streetmix is free, runs in a browser and was built specifically for cross sections of streets, so it is the quickest option for students and public meetings. For construction drawings, offices still use CAD, and for 3D city models Esri’s CityEngine includes a Street Designer.
Where to Go From Here
Your Next Step: Pick a street you walk every day, pace or measure its full width from building to building, and draw its existing section with every band dimensioned. Then redraw it with 10-foot lanes and see what the freed width could become.






Leave a comment